
CURRENT_YEAR()
Here it is, 2017. A full 20 years since SQL Server 7. Back then, there was a developer named Nick. Nick was on the development team, and apparently the query-costing-magic development was done on his machine. All of it. The magical metric was that for every second a query ran, it would cost another query buck. If a query ran for 5 seconds, meaning it cost 5 query bucks, the optimizer would start examining parallel plans.
These query bucks still exist today, but due to massive inflation, they are no longer worth the same amount. In the words of Joe McGrath “See this quarter? It used to be a nickel.”
They’re still a valuable reference metric, but they are, even for actual plans, still an estimated cost. Pay attention to them. Pay attention to the fact that THEY DON’T MEAN SECONDS ANYMORE.
The thinking, of course, is that if you gave a query more cores and more threads, it would run faster. If you give it another core, 2x faster. If you give it four cores, 4x faster. The math behind this was done by a guy named Gene Amdahl. I didn’t know anything about Gene Amdahl until Adam Machanic talked about him, and that’s still as much as I know about him.
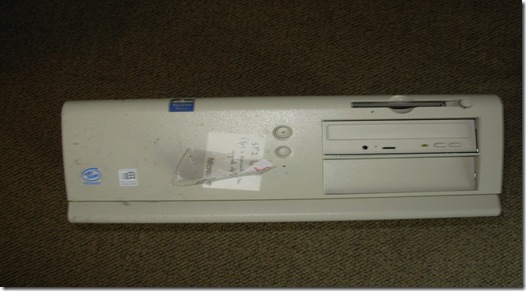
This story is corroborated, at least in part, by a Conor Cunningham talk at SQLBits. There’s another blog with the picture of Nick’s computer.
Your server
I’ve seen your servers. I’ve made fun of your servers. I built a home server just so I could make more fun of your servers.
Despite all that, I’m willing to allow that your server, even if it was built special for 2008R2, is better than Nick’s computer. I mean, my cell phone is better than your server, but still.
So why is it that you’d want to use 1997 settings on present day hardware?
Tiny Queries
Small queries, let’s say with a cost under 50, typically don’t see any stunning improvements when comparing parallel vs. serial execution. They may even degrade slightly just because of the startup and computational overhead of going parallel.
But the real stinker is something I’ve talked about a couple times before. You can actually harm concurrency and force yourself into some nasty THREADPOOL situations if you don’t control parallelism. Parallel queries use more threads. Your server has a finite number of threads. When every little query is going parallel, you run out of threads faster. When you run out of threads, no one is happy. It’s like running out of toilet paper. People start getting anxious.
You can also run into situations where, when many queries start going parallel, one of many threads may get blocked, or held up, and then SOS_SCHEDULER_YIELD kicks in. That’s SQL telling your query it’s time to take a break and let someone else try to run. If your server has long average waits on CXPACKET or SOS_SCHEDULER_YIELD, you can bet your bottom query buck that CPU contention is occurring.
This is beyond Cost Threshold, though it’s important to start here. Usually 50 is a decent number, but you can go up or down based on your workload. You’ll also want to set MAXDOP appropriately.
After that, it’s all sorts of nasty query and index tuning to get things under control.
You should call a professional for that.
Brent says: this is one of those areas where I wish Microsoft would publish better guidance (if they won’t flat out change the defaults). 5 is clearly wrong today, and I’m kinda surprised that they haven’t gathered better evidence from Azure SQL DB and 2016’s phone-home defaults.

33 Comments. Leave new
In my work, we found a strange behavior when we changed the value of Cost to a greater one (5 -> 150), and the Execution Plan determined that only indexes were involved in the execution (mix between Clustered and Nonclustered Indexes & Clustered Columnstore Indexes) … even when the tables using the Clustered Columnstore Indexes had 1.5-2 billion rows (DWH fact tables), determined a very low cost for a query that was to return at least 500 million rows in the process … and therefore, a query that previously took 5 minutes, it took 24 hours to finish with the new cost (the Columnstore was processed in ROW mode in the query plan) …
Recently I requested to install the pending Service Packs and CU in the production environment, in case it is a bug already corrected. But in the meantime we had to reset the value to 5 (the last cost before was 25, but we found a query with behavior similar to when the cost was 150, but with a smaller Fact Table, 30 million records, its execution time Change from 30 seconds to 45 minutes)
Well, 150 seems a bit random. How’d you come to that number?
Queries that use CS indexes (I wanna say prior to 2016) that run serially (MAXDOP 1) operate in Row mode rather than Batch mode, and that really screws performance. You might even see that if you’re using 2016 and have a DB in an earlier compat mode, but I haven’t tested.
150 was a recommendation from a Microsoft specialist who visited us to do an evaluation of the configuration of our internally migrated Dataware from Oracle to SQL Server (It was one of the Premier Contract services of the Telecom where I work)
Currently we are with the RTM version of 2014, that is the reason for my request to apply service packs and pending cumulative updates
Oh, those Microsoft Specialists 😉
Sometimes it can be your statistics, too. I was working on a server recently that had crazy high CXPACKET waits and a good chunk of SOS_SCHEDULER_YIELD. I changed the cost threshold around and it did basically nothing – I even saw an increase in CXPACKET waits (proportionally to other waits, of course). The fix was to update statistics on the major tables with a full scan. I guess SQL Server was making wrong guesses when deciding how to parallelize. After the statistics update, CXPACKET dropped from about 89% of all waits down to 16%.
Just something to keep in mind if changing the cost threshold isn’t working for you.
-Joshua
It may be … according to something I read on a blog earlier (I think Niko’s … http://www.nikoport.com/), I think the Clustered Columnstore Indexes do not handle statistics in the same way That the other indexes do … it is probable that the set of situations have triggered something similar to what you are commenting
PS: I am using Google Translate to correct my English … apologies if something is not understood correctly
Well, yeah, if all your queries are still over whatever cost threshold you set, it’s not going to change much.
Just remember not to tune wait stats by percentages.
Ah yes, looks like it’s an Optiplex GXPro. Such a workhorse, those old GX models.
Well, at least they gave you lots of horses…
=|
I created a SQL Server Connect item – if you think this is important then please vote for this connect item
https://connect.microsoft.com/SQLServer/feedback/details/3128949
At a meeting with SentryOne; I said in a new build I set Cost Threshold For Parallelism to 50, to start. In a following webcast by them, I was referred to as: “don’t be that guy that sets Cost Threshold For Parallelism from 5 to 50”.
Thank you for pointing out why it is a good starting point.
Oh, interesting. Does PA give you guidance on what to set CTFP to? I haven’t seen that in my demo install anywhere.
There’s a lot of “it depends” in this scenario. My experience has been that the right setting depends on the type of load and the number of cores available. I got to test this extensively in 2008R2 using a dedicated test environment and Loadrunner. We ran scripts that simulated 3000 users over a 10 hour period. The app was barely functional at 5. When I bumped it to 50 it improved dramatically. Ultimately we settled at 200. That’s ridiculously high you might say but this app had a lot of “reporting” type queries that did 200 table joins. (I didn’t design the POS by the way.) What I found was that this was the happy place where the 200 table joins and the little reference table look-ups lived relatively happily together. I also saw the average cpu usage drop from 60% to 20% for the same load. This was a fascinating gig as we captured every stat we could in perfmon and I had the luxury of trial and error to find what worked and what didn’t. BTW, in conjunction with that I learned that setting maxdop to roughly half the number of available cores also struck a nice balance as it left some cores free to handle the short transactions. Without doing that the 200 table join queries would seize all of the cpu and cause all kinds of blocking problems.
Hi Bob,
I’ve found MAXDOP, at the server level works well with your recommendation.
However, I have SSIS projects that run up to 20 parallel threads that are then generating SQL at Core Count / 20 + 2. I’ve adjusted MAXDOP trying to find a happy medium; just to figure out one solution isn’t ‘one size fits all’. By hinting based on cores/threads+2 I am able to watch all CPUs push to 90+%. I’ve watched the same cores sit idle and maybe two set at 90% for the duration of a data load. By splitting out the load into 20 threads and taking a single stored procedure I could divide the number of records by the total records to process, set Start and End ranges, and load 80 days worth of processing into just under 2 days. The Cost setting was pushed up high enough that none of the underlying queries every hit it. This also ensured my setup wouldn’t be compromised by SQL Server’s wisdom. LOL!
So how did you come up with 50 as the starting point as opposed to a different number? Trial and Error, factoring for hardware inflation since ’97, or is there some other reason? I’m not arguing with the fact that the default is rarely appropriate; rather I’m interested to understand how you settled on 50.
Pretty simply, actually. For most OLTP queries, parallelism isn’t desirable. You’re doing (largely) PK/singleton lookups, perhaps with a slightly larger number of rows to a table that has a list of items in an order.
Queries like that shouldn’t have a cost anywhere near 50, unless you’ve done something very wrong with table/index design, or you’ve written queries that need a drool dish.
Fifty sets just a high enough bar that your OLTP workload shouldn’t dominate your server with parallelism, but still allows any reporting workload (and perhaps ETL tasks) to go parallel when necessary.
Thanks!
You’ll also hear some folks say 40, and others say 75 – those are fine too.
I started with 20 and it has already improved throughput as measured by wait times dramatically. Went from averaging 35 hours of total wait time a day on the server to less than 5 hours and most of that is I/O waits and associated with log shipping.
[…] sample database. But that database is too small to get parallel execution plans without setting the parallelism threshold to some weird non-representative low value. So I decided that for this post I am going to use one […]
Is there a query i can run to have an aprox number ?
Sure, try this:
SELECT 50 AS approximate_number;
That will produce an approximate number.
Somebody drank an extra large dose of smart-ass juice this morning.
Breakfast of Champions.
exactly
You could try this:
https://eitanblumin.com/2018/11/06/planning-to-increase-cost-threshold-for-parallelism-like-a-smart-person/
I came cross a link from SQL Expert and he suggested to start with 30 for the Cost for Threshold Parralelism.
OK
I laughed. Like a lot.
Just my entry on this post…
When I first laid eyes on the servers at where I currently work full time, I changed them all from 5 to 25. It was a pretty good guess because if I go much above that on the big server (combined OLTP and heavy processing jobs), things started to slow down substantially.
I tried the same #, 25, at a different company I was part-timing at and it didn’t make much of a difference until I got close to 50 on one server and worked fine at 25 on another. It seems to be what types of work load you have going on and what the “split” between OLTP and big processes is.
As with all else in SQL Server, “It Depends” and “Must look eye”1 😀
It’s sad to see Microsoft being this extreme conservative about introducing configuration changes into the product over the years. While I admit it does good for all of us consultants 🙂 , and we can write tons of blogs, articles about this each month, it’s frustrating to see that they do not really want to optimize these features, or plain and simply get rid of them for good, or hide them that no one can tweak them, or at least give proper guidance about them. As much as I love SQL Server, it’s a little bit tiring to tell the same old passages over and over and over, while adding occasionally: do not use this by the way. Why it’s still in the product? Also, it’s 2021, and where is the automation and intelligence that fine tunes the database environment? I know, it’s in Azure SQL Database, but it’s not there yet either (in it’s full glory at least). Same for the tools, SQL Server Management Studio for instance, which we all use on a daily basis, but it’s seemingly stuck somewhere in the 2000s, including the UI.
Especially lately… forcing the equivalent of TF 1117 on Temp DB has caused me some serious problems in times where some repair code used a lot of TempDB but only in a single thread. Imagine my surprise when what used to take “only” 20GB suddenly required 160GB because there are 8 files that all grow to the same size and can’t be even temporarily overridden in TempTB.
And how about that “Fast Insert” feature they defaulted to on? Most people don’t know what that even does nor the devastating effect it can have when the front-end is written to us an “Insert Bulk” (not to be confused with “Bulk Insert”) for single row inserts. (Creates an entire extent to store , one row!).
I wrote a blog post about this topic a while later after this post. It suggests a script and methodology for determining the best CTFP, based on your SQL server behaviour (at least, a better methodology than “just try 50”) :
https://eitanblumin.com/2018/11/06/planning-to-increase-cost-threshold-for-parallelism-like-a-smart-person/
Ooo, neat, I like it!