
When I first look at a server, I want to know how busy it is, where its bottlenecks are, what is SQL Server waiting on and many other things. Batch Requests/sec is one of the data points that is used to measure how busy a server is.
WHAT IS BATCH REQUESTS/SEC?
Batch Requests/sec is a performance counter that tells us the number of T-SQL command batches received by the server per second. It is in the SQLServer:SQL Statistics performance object for a default instance or MSSQL$InstanceName:SQL Statistics for a named instance.
WHAT COMPRISES A BATCH?
If I execute a stored procedure that has multiple queries and calls to other stored procedures, what will Batch Requests/sec show? Let’s test it to find out.
I created three stored procedures:
- Run four SELECT queries
- Call the first stored procedure twice
- Call the first stored procedure, call the second stored procedure and run a SELECT
|
1 2 3 4 5 6 7 8 9 10 11 12 13 14 15 16 17 18 19 20 21 22 23 24 25 26 27 28 29 30 31 32 33 34 35 36 37 38 39 40 41 42 43 |
CREATE PROC BatchRequestsTest1 AS SET NOCOUNT ON; SELECT DisplayName, CreationDate FROM Users WHERE Id = 1; SELECT PostId, CreationDate FROM dbo.Votes u WHERE Id = 44; SELECT * FROM PostTypes; SELECT TOP 100 * FROM Comments ORDER BY Id DESC; GO CREATE PROC BatchRequestsTest2 AS SET NOCOUNT ON; EXEC BatchRequestsTest1; EXEC BatchRequestsTest1; GO CREATE PROC BatchRequestsTest3 AS SET NOCOUNT ON; EXEC BatchRequestsTest1; EXEC BatchRequestsTest2; SELECT Text, Score, CreationDate FROM Comments WHERE CreationDate > '03/08/2015'; GO |

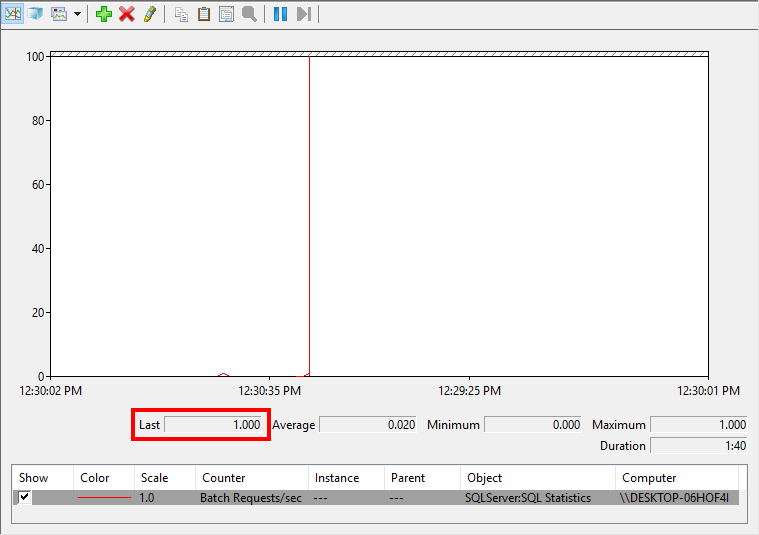
When I execute BatchRequestsTest1, Batch Requests/sec turns to 1 even though BatchRequestsTest1 contains four SELECT queries. It then goes back to 0.
|
1 |
EXEC BatchRequestsTest1; |

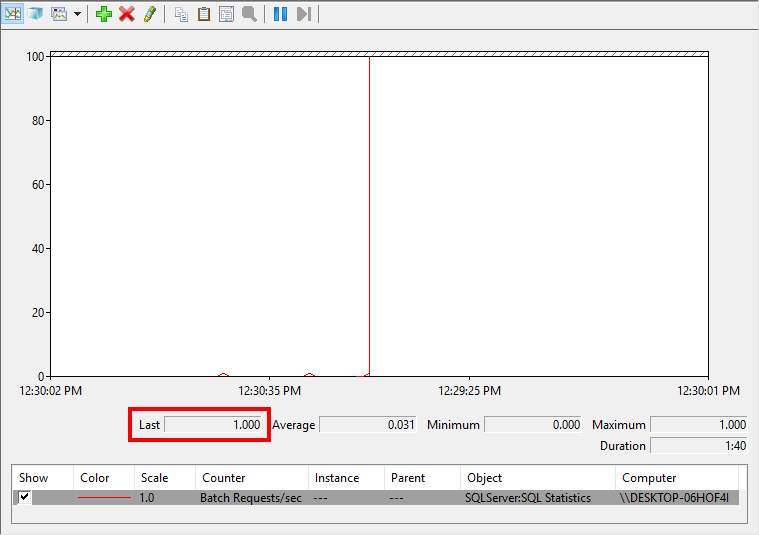
Batch Requests/sec is 1 when I execute BatchRequestsTest2 and then goes back to 0.
|
1 |
EXEC BatchRequestsTest2; |
You can probably already guess what Batch Requests/sec will be when I execute BatchRequestsTest3.
|
1 |
EXEC BatchRequestsTest3; |
Highlight all three executions and then click execute. Batch Requests/sec is 1 as all three executions are in one batch.
|
1 2 3 4 5 |
EXEC BatchRequestsTest1; EXEC BatchRequestsTest2; EXEC BatchRequestsTest3; |

No matter how many queries are inside a batch, it will add 1 to Batch Requests/sec. For systems that have very long, complex stored procedures, Batch Requests/sec may not be a good metric to determine how busy the server is. You have to combine the metric with everything else you look at.
WHAT IF MY SCRIPT HAS GO IN IT?
Let’s look at one more example. This script has two GOs. GO signals the end of a batch of T-SQL statements in some utilities, such as Management Studio. If I execute the below script all at once, what will Batch Requests/sec be?
|
1 2 3 4 5 6 7 8 9 10 11 12 13 14 15 16 17 18 19 20 21 22 23 24 25 |
BEGIN TRAN; UPDATE Users SET Reputation = Reputation + 1 WHERE Id = 1; UPDATE Users SET Reputation = Reputation + 1 WHERE Id = 1; UPDATE Users SET Reputation = Reputation + 1 WHERE Id = 1; UPDATE Users SET Reputation = Reputation + 1 WHERE Id = 1; GO UPDATE Users SET Reputation = Reputation + 1 WHERE Id = 1; GO ROLLBACK TRAN; |
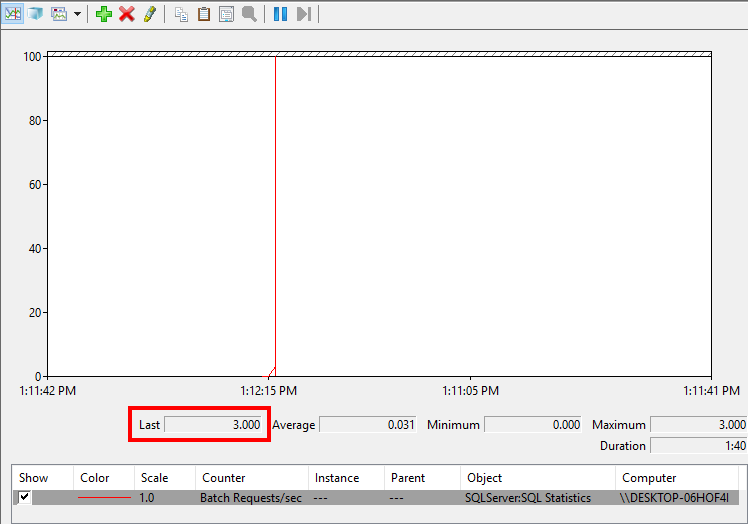
Why is it 3? BEGIN TRAN to the first GO is one batch. The UPDATE after the first GO and to the second GO is another batch. And the ROLLBACK TRAN is the third batch.
WHERE CAN I FIND BATCH REQUESTS PER SECOND?
I use Performance Monitor, a T-SQL query or sp_BlitzFirst to check Batch Requests/sec. You could also use PowerShell, C# and many other programming languages to query performance counters.
In Performance Monitor, click the plus sign to add a counter and then navigate to the SQLServer:SQL Statistics or MSSQL$InstanceName:SQL Statistics performance object. Expand the object, select Batch Requests/sec, click Add and then click OK.

To query Batch Requests/sec via T-SQL, you have to calculate the difference of two samples over a time interval as the value is stored as a cumulative value since the SQL Server has been up.
|
1 2 3 4 5 6 7 8 9 10 11 12 13 |
DECLARE @v1 BIGINT, @delay SMALLINT = 2, @time DATETIME; SELECT @time = DATEADD(SECOND, @delay, '00:00:00'); SELECT @v1 = cntr_value FROM master.sys.dm_os_performance_counters WHERE counter_name = 'Batch Requests/sec'; WAITFOR DELAY @time; SELECT (cntr_value - @v1)/@delay FROM master.sys.dm_os_performance_counters WHERE counter_name='Batch Requests/sec'; |
Let’s look at Batch Requests/sec via sp_BlitzFirst.
|
1 |
EXEC sp_BlitzFirst; |

If you use @ExpertMode = 1, then you’ll see it in the first result set like above and also in the fourth result set with all of the other SQL Server performance counters.
|
1 |
EXEC sp_BlitzFirst @ExpertMode = 1; |

HOW BUSY IS YOUR SERVER?
I’ve supported servers that had Batch Requests/sec over 10,000. I know there are much busier systems out there too. Some of our clients have low Batch Requests/sec, under 1,000. Drop a comment with the Batch Requests/sec value on your busiest server during the busiest time of the busiest day.
Brent says: if I know a server well, this is the first place I look when someone says queries are slow. Maybe queries are slow because we’re dealing with 10x more queries than we usually get – maybe the web site is on fire because somebody made a pricing mistake, for example. When this metric goes up, it affects every other performance metric.

46 Comments. Leave new
Batch Requests per Sec 446
CPU Utilization 32%.
SQL Compilations per Sec 67
SQL Re-Compilations per Sec 8
Wait Time per Core per Sec 0
how and where can we take this values from sql
Brent covers this topic in detail in his Performance Tuning class, this is an excellent training course that I took last month. My Batch Requests per second was 153.7
medium-busy time of day (right now) 4566 batch/sec
Busy-ish time of day now, ~8400 batch/sec
Busy days > 130000 batch/sec
Busy time 10-11K
Uh-oh. Third party app, probably less than 30 users: 2593392
but Spotlight (free version) says 300. ??
NVM, wasn’t looking at value per second! D’oh!!
We had a server that was doing around 10K+ Batch Request per sec until a recent update.
It is now down to under 2K+ per sec after a recent update. This update was prior to tripling (3 times more) the amount of user and server applications that connect to a single database.
The difference in CPU utilization was like we had added another 8 cores.
The difference in database updates to code that existed in the database was nill.
What changed?
The application was updates to not make a new all database call with a new SQL connection object for every database call.
Now each page and DAL section of code executes in single batches.
This means we see when tracing only one RPC reset and reconnect per page load instead of 100+.
Short Story: Don’t make a new database connection and database command for every single database call.
Gather them together in batches that populate a local dataset in the DAL.
BTW – Using LINQ and MVC default data connectors does not reduce batches. They seemed to have bee designed to increase them in the name of better Sargasim
742 batch requests… CPU @7%
21.000 batch/sec on x3950 with 60cores. TempDB and Log files on FusionIO raid.
About 75,000. The App shreds very moderately-sized import files (500 MB to 2 GB) into individual XML records then pushes them into BizTalk where a bunch of business rules run on each record.
DESCRIPTION: The SQL Server performance counter ‘Batch Requests/sec’ (instance ‘N/A’) of object ‘SQL Statistics’ is now above the threshold of 2500.00 (the current value is 3058.45).
Nordic OLTP system, Wednesday 14:29. Lot’s of small SP:s running.
~200 requests/sec, and those are generally trivial queries.
I get the feeling that this 32-core, 64 GB RAM machine I inherited is a bit overkill 😛
1 day window
SQL % Processor Time min 21%/48 avg 587%/48 max 4652%/48
Batch/s min 500 avg 74820 max 339920
Compilation/s min 0 avg 409 max 2760
re-compilation/s min 0 avg 0,02 max 5
5000 odd..
1,500
Good stuff. It takes just one bad batch to screw all the others, though 🙂
Hello,
Is it possible to get the batch requests per second but not for the entire server but for databases and hard drives?
Would different data usage patterns have an impact on overall performance of a database? Let’s say there are two databases A and B, both of them with similar amounts of total bytes read and written.
But database A has performed those writes and reads in let’s say 20 batch requests per second, while
database B has performed those writes and reads in 200 batch requests per second.
Further more, on database A the behavior generally is: write once, read many times, while on database B for every write operation there is also a read operation.
I would create those two databases on different hard drives, but I am not sure if letting them on the same drive would do much harm. Would there be some performance degradation either for database A or B if the lie on the same disks?
Do you have an advice for this kind of setup?
Thank you!
my busiest instance is 2,063,669,731 batch/sec.
least busy instance is 4,255,782 batch/sec
Just for others reading this comment, see Albert’s comment below. His batch requests/sec is around 5500 and not 2 billion or 4 million. 😉
I had batch envy for a second there…..
I posted wrong number.
Correct number should be:
busiest instance is 5465 batch/sec.
That makes more sense than the other numbers. I doubt there’s any system in the world with batch requests/sec that high on a single instance. If a system is going to be busy like that, then you’ve scaled out to multiple instances.
Batch Requests/sec 48507770
SQL Compilations/sec 551908
SQL Re-Compilations/sec 34445
Seems really high to me!
What source is it from? I suspect you are querying it via TSQL and are looking at the wrong column which is showing you how many there have been since the server has been online and not a per-second value.
Actually, not “wrong column”, but you need to do a calculation to get the per-second value. Run the query, wait 5 seconds, run it again. Do a diff between the values and divide by 5. You can use sp_BlitzFirst to look at this data too, or Performance Monitor.
Thank you, you were correct! It was since the server had been online.
Hello, i have on AVG 9,224 and a MAX of 22,289. This isn’t good right? The fun part is that in that server it works perfect. But in the PROD Environment with AVG 524 and MAX 1,010 work like garvage 😛
Felipe – there’s nothing good or bad about it, it’s just how many queries you’re handling. The next step is to find out what those queries are, though.
Hey Brent,
My server has about 10k requests/sec, but I’m beginning to see deadlocks et I/O bottlenecks. Does that mean my hardware/setup has reached it’s limits? I’m trying to figure out if it would be a good time to have a second SQL Server but I have to be sure before asking my boss. Currently we have 135 client’s databases on one server (approx 7500 users), with clients working 24/7, supporting mobile and desktop devices. My guts tells me we’ve reached our limits but I wanted to have your opinion.
Thanks!
Danielle – well, when it’s time to add additional servers, that’s usually beyond the scope of something we can recommend fast in a blog post comment. For example, you just might need some index tweaks, or maybe your backups aren’t even matching your RPO/RTO. That’s where our consulting comes in – click Consulting up at the top of the page to get an idea for what we do. Thanks!
Thanks I’ll check it out.
Load testing…
2 vCPU. 4000 batch req per sec.
MAX Compilations per sec – 125.
MAX Recompilations per sec – 47.
MAX Processor queue length 25 !
No complaints from users.
Priceless…
I had a Microsoft support call, where the engineer requested to increase the CPU as the Batch request per sec was 2000-4000 and CPU 23% on a 32Core box 😀
Well, they do get paid by the CPU core for licensing, heh heh heh.
Is there any way to see the historical value for Batch request per second.
You would need to log the data.
If Batch Requests / sec is a measure how many requests were received, how do you measure the number of requests that were actually completed? This would tell us whether throughput has actually reduced.
Well, if those don’t complete, you would have lots of blocking…
batch requests/sec = 70k
transaction/sec = 12k
Avg CPU 25% peak CPU 40%.
sql-sever in gcp. highly over provisioned(160core) .
soon to be move to postgresql.
Any pointers on how to find top queries contributing to highest number of batch/sec or tran/sec metric?
Goal is to find what can be off load to another server with highest impact to bring down the tran/sec metric value .
Yes, I teach you in my How I Use the First Responder Kit class.
Avg Batch requests/sec for the last 6 hours = 52K
Max Batch requests/sec for the last 6 hours = 71,5K
CPU hovering around 20-40%
48 Cores, 384GB RAM running in Azure VM in a production environment.