
I’m going to use the dbo.Users table in the StackOverflow demo database and run a pretty simple query:
|
1 2 3 |
SELECT * FROM dbo.Users WHERE DisplayName LIKE 'Brent%'; |
First, hit Control-L in SSMS and get the estimated execution plan. Here it is:
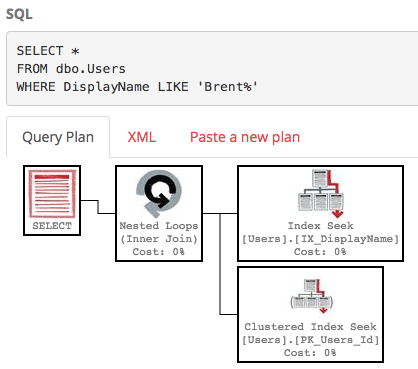
Click on the plan, and hover your mouse over the various operators. You’ll notice that almost all of the fields are prefixed with “Estimated” – because of course SQL Server doesn’t know how many rows will come back, how many times an operator will get executed, or how big the rows will be.
Now in SSMS, click Query, Include Actual Execution Plan, and then run the query. Here’s the actual execution plan:
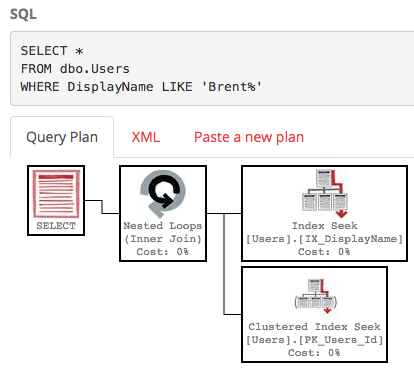
At first glance, the overall shape and the operators look identical. Hover your mouse over each operator, though, and you start seeing a lot more information. Here’s a few examples:
- On the index seek, the estimated number of rows was 1,416, but the actual number of rows was 858
- That influences the Clustered Index Seek (aka Key Lookup), where we thought we’d have to do 1,416 executions, but Number of Executions is actually 858
- On the SELECT itself, the estimated plan didn’t say anything about degree of parallelism or memory grant, but the actual plan does
When I tell people to always start tuning with the actual execution plan, it’s not because the shape of the plan might be different. (It might – but that’s typically due to runtime differences in memory available, like if a server doesn’t have enough RAM to let the query go parallel.) Instead, you want to look at the actual plan simply because it’s got more juicy metrics available, especially metrics that point out where SQL Server’s estimates were off.
Estimation mistakes can be caused by:
- Non-sargable queries
- Out-of-date statistics
- Missing statistics
- Cardinality estimation bugs
And much, much more. To catch this stuff, you need the actual plans.

2 Comments. Leave new
How did you get that cool Query Plan Display? – I would assume that is not an actual screen from SSMS.
If that is SSMS – could you please provide details on how to get SSMS to look like that??
Take a look at the links, they’re the custom operators from brentozar.com/pastetheplan 🙂