
Microsoft has been quietly making some amazing improvements for performance tuners in SQL Server 2012, 2014, and 2016. This week, we’re going to introduce you to just how awesome they are. (They being the improvements, not Microsoft. You already knew they were awesome.)
Using the freely available StackOverflow database, let’s start with a simple query – SELECT * FROM Users:

When I hover my mouse over the SELECT in the execution plan, I get a little popup with things like estimated subtree cost, estimated number of rows, and more.
Now let’s add an ORDER BY:
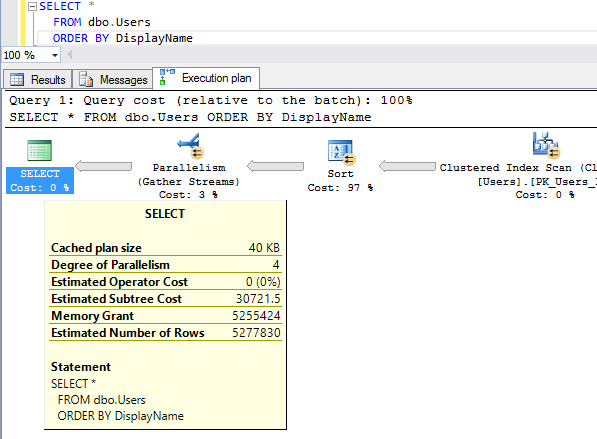
When I hover over the SELECT, there’s a new line in town: Memory Grant. SQL Server needs RAM to sort the list of users before delivering them back to us. It didn’t need memory for the prior query because it was just dumping the data out as fast as it could read it.
You can see more details about the memory grant if you right-click on the SELECT and click Properties:

When SQL Server builds your query’s execution plan, it has to guess:
- Desired Memory – how much this plan wants in a perfect scenario, in kilobytes. Cached as part of the cached execution plan, and will remain consistent for all executions of this plan.
- Granted Memory – how much this execution of the query actually got. This can vary between execution to execution depending on the server’s available workspace memory at the time. Yes, dear reader, this is one of the reasons why sometimes your query is slow, and sometimes it’s fast. This value is not cached as part of the plan.
- Grant Wait Time – how long this execution of the query had to wait in order to get its memory. This relates to the Perfmon counter Memory Grants Pending. Not cached, since it varies from execution to execution.
- Max Used Memory – how much this execution used, and also not cached obviously. This is where things start to get interesting.
SQL Server’s query grant memory estimates are really important.
If it estimates too little memory, then as your query starts to bring back more and more data and it runs out, then you’ll be spilling to TempDB. That’s why we freak out when user-defined functions only estimate 1-100 rows will come back, or when table variables only estimate 1 row will come back.
As we join those objects to other things in our query, SQL Server may wildly underestimate the amount of work it has to do for the rest of the tables. You can see this in action in my Watch Brent Tune Queries video from SQLRally Nordic in Copenhagen.
On the other hand, when SQL Server estimates too much memory is required, we have a different problem:
- Your query may wait a long time just to start because that estimated memory isn’t available
- SQL Server may clear out a lot of otherwise-useful memory just to run your query
- Other people may have to wait for memory because a ton got allocated to your query
You can see this one in action in Kendra’s AdventureWorks query that estimates bazillions of rows. It estimates 10.5 terabytes of data will be handled, when in actuality it’s only 292MB.
But we’ve been flying blind – until now.
Until now, it was really hard to troubleshoot these issues. While the plan cache does show us how much memory a query would want, it didn’t show us how much was actually used.
We could try running the query to get the actual plan, but even that didn’t always get us the right answer. If we were suffering from parameter sniffing problems, one set of parameters might work fine while the other would produce catastrophic underestimates or overestimates.
We could try using Profiler or Extended Events to catch spills or huge grants as they happened, but…let’s be honest, you’re not doing that. You’re the kind of person who barely finishes reading a blog post, let alone starts firing up a tool before problems happen.

9 Comments. Leave new
Great post Brent.
I’ve been checking sys.dm_exec_query_memory_grants lately, comparing Granted Memory and Max Used Memory. Has been very helpful in finding poor queries. Have seen grants +4 GB that only use <200 MB. What a waste!
We proactively stash the results from dm_exec _query_memory_grants thoughout Dev and test environments to get this.
More often it helps identify where stats are stale than true memory hogs though, which is useful too.
Now might be a good time to mention the query memory cap, which is a maximum of 20% of maximum work space memory from dm_os_performance_counters (in itself a max of 75% of target server memory). It took some digging for me to find why all large memory queries maxed out at the same value. Min query memory is a more obvious setting of course in sp_configure.
Oh don’t forget resource gov might influence that too.
This is an interesting post and thanks for writing it.
I have a good feeling that my comment will elicit the responses of “this goes beyond the scope of a blog post” and “sp_BlitzCache can do this”. But I’m going to give my feedback anyway because I guess other people will come along and read it over time too. Besides, scouring through 2,800 odd lines of SQL code trying to reverse engineer a concept isn’t easy 🙂
My feedback is that I’m left wanting a bit more about how to this fits in with the ecosystem, and how to use it (beyond just viewing it in a plan).
So far it seems:
* Performance counters for memory grants outstanding is still a go-to indicator for memory issues (you blogged about it here https://www.brentozar.com/archive/2013/09/how-to-prove-your-sql-server-needs-more-memory-video/)
* If you observed issues you would probably jump into sys.dm_exec_query_memory_grants to see an exactly-at-this-moment snapshot of what’s going on. But it will be gone in an instant. Aaron above says he stashes them but I’m not sure how much he grabs, on what kind of schedule, and what other analysis of thresholds is done on it.
* And afterwards you can scan the plan cache for these new fields to pick up old issues on some kind of threshold. It’s not clear if it’s a good idea to stash this also or if it’s likely not going to be worth it. It’s not clear if it would replace stashing sys.dm_exec_query_memory_grants.
Definitely outside of the scope of a blog post but if others want to write more about it then please do and (maybe) share the links.
I ran into issues recently with pending memory grants on our large reporting warehouse designed through a vendor, our main vendr, Whom I will not name(Healthcare). One note is that Vendor recommended in SQL 2014 we run the DB in 2012 mode. The machine with 3TB and 2.7TB assigned to SQL would max out memory and have many memory grants waiting all the time. Causing so much pain for those end users waiting for their reports.
In looking I found that we have some reports that are ran in multiple for different departments. Each of these runs were requested and being reserved close to 470GB of RAM. OF note when I ran in 120 CE using the option it would request only around 80gb, so not even comparable as was the query costs. After looking and figuring out the max_used_memory by these queries above I ended up turning to resource governor to limit the max memory grants to 10% available. This cleared all our grants and since the queries that I limited memory too never actually used that much we still ran fine with no spill to tempdb, well besides one runaway query that needed to be fixed.
All This, of course, is until I can get the vendor to prove to me and show me why we cant run in 2014 and use the new 120 CE. I really only want to use the Resource Gov as a stopgap and only enable it in the morning and disable it well before our ETLs. That is one use of figuring out and using memory grants granted and max_used memory. At least now with much better stats on these I was able on my end to figure what was reserving and then not using my memory.
Hello sir, Cab you explain how to increase/ decrease the amount of memory that query is take to execute.
because in my case query take 16KB and assigned value is 1 kb. So i want to increase up to 1mb because my query is dynamic.
Kalpesh – for individual query tuning advice, start here:
https://www.brentozar.com/archive/2009/03/getting-help-with-a-slow-query/
[…] https://www.brentozar.com/archive/2016/08/memory-grants-week-introduction-query-memory/ […]
Hi Brent, first time poster.
How about memory grant vs execution time?
As an example, I have a query that with a subselect gets a memory grant of about 33MB.
As an alternative, if I use a query to get the same results, but using a left join instead of the subselect to get the same value, it gets a memory grant of 87MB.
However, the second query takes between 1-2 seconds to finish, while the first takes about 6 seconds.
Which one should i favor? I’d guess the second query would be better because it takes much fewer time, releasing memory as fast as it grants, but i’d like your input on this.
Great question! We dig into those kinds of questions in my Mastering Query Tuning class. See you there!