
SQL Server 2016 is adding some really awesome stuff
Not the least of which is a ton of super cool information in execution plans, and an Extended Events session to expose the same information for all queries. The details are detailed in detail over on this blog post from MS.
For those of you with clicking allergies, a whole mess o’ run-time information is being recorded in execution plans, and by a new Extended Events session called query_thread_profile. Microsoft may be changing, but they still pick horrible names for things. Query Thread Profile sounds like one of those stores the size of a closet that sells four t-shirts that all cost $1000.
Let’s play with Extended Events
You can’t see any of this stuff in the graphical execution plan yet, only the plan XML. It’s only in actual execution plans, and in the XE session. If you read that and paused made a face, yeah, the run-time stats aren’t in cached or estimated plans. With Query Store’s capabilities, it’s probably less necessary to jam this stuff into every DMV and cache, so I’m not all that bummed about it.
Anywho! If you’ve got SQL Server 2016 RC0 or later installed, you can plug this in and run some queries. You will probably need to change the session ID I’m filtering on here.
|
1 2 3 4 5 6 |
CREATE EVENT SESSION [RunTimeStats] ON SERVER ADD EVENT sqlserver.query_thread_profile( ACTION(sqlos.task_time,sqlserver.database_name,sqlserver.plan_handle,sqlserver.session_id,sqlserver.sql_text) WHERE ([sqlserver].[session_id]=(55))) ADD TARGET package0.event_file(SET filename=N'C:\temp\RunTimeStats',max_rollover_files=(10)) GO |
I’ll be running stuff against StackOverflow, as usual. If you write dumb enough queries, you can really keep a server (laptop) busy for a while. A quick word of warning: this session will store one row per node, per thread, per query. You can really quickly end up with a lot of data in here. You’ll see in a minute what I mean, but let’s run some queries first. You will be sorely disappointed with the data if you don’t run any queries.
|
1 2 3 4 5 6 7 8 9 10 11 12 13 14 15 16 17 18 19 20 21 22 23 24 25 26 27 28 29 |
ALTER EVENT SESSION [RunTimeStats] ON SERVER STATE = START; SELECT [DisplayName], [p].[Title] FROM [dbo].[Users] AS [u] JOIN [dbo].[Posts] AS [p] ON [p].[OwnerUserId] = [u].[Id] WHERE [u].[ID] = 26837 AND [p].[PostTypeId] = 1 GO SELECT [DisplayName], [p].[Title] FROM [dbo].[Users] AS [u] JOIN [dbo].[Posts] AS [p] ON [p].[OwnerUserId] = [u].[Id] WHERE [u].[ID] = 483467 AND [p].[PostTypeId] = 1 GO SELECT [u].[DisplayName] FROM [dbo].[Users] AS [u] WHERE [u].[Id] = 26837 GO SELECT [u].[DisplayName] FROM [dbo].[Users] AS [u] WHERE [u].[Id] = 483467 GO ALTER EVENT SESSION [RunTimeStats] ON SERVER STATE = STOP; |
Code to parse the session data will be at the end, as usual. Good grief, I have an “as usual” for Extended Events posts. Here’s what we get back.

That thing I said about nodes and threads, here’s a good example of it. The query plan and text columns will all look about the same, because we ran basically the same query two times twice. Node three of the first query used four threads. Remember that in every parallel execution, there’s one coordinator thread that doesn’t do any actual query work, that’s why you have 0-4 for thread IDs, totaling five.
Looking at the plan from our XML column confirms most of this. But again, cached plans offer less information overall. If you get the actual plan here, you’ll be able to see degree of parallelism information.

Checking out the rest of the results, all the promised information is in there: CPU time, total time, rewinds, rebinds, row information, IO information, and so forth. Very powerful stuff. I hope this turns into an easy way to detect imbalances in parallel plans — when one or more threads process way more rows than the rest. That can really hurt you if, say, one thread ends up processing a million rows, and the rest aren’t doing anything. Not very parallel, that.
But one thing I think is really cool, and it’s not just information you can get from this XE session! You can get it from a couple others that I’ll blog about in the future, is what input(s) queries ran with when they’ve been parameterized, or run as stored procedures with inputs passed in. Not just the compiled value, the run-time value! Hooray. Think of all the nights and weekends you can spend fixing things! Just like I pictured the 21st century.
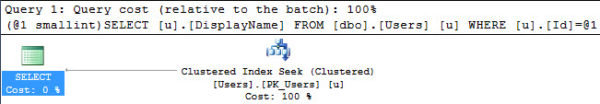
For our simple queries against the user table, here’s what you get for the execution plan. You can see it’s been, simple… simply… parameter… ized? There’s been simple parameterization. There we go. That’s the @1 smallint business going on in there.
And here’s what the XE query brings back for query text.

More trouble coming every day
SQL Server 2016 is looking pretty promising in quite a few areas. I’ll be blogging about all the stuff that catches my eye, so stay tuned.
Thanks for reading!
Begin code!
|
1 2 3 4 5 6 7 8 9 10 11 12 13 14 15 16 17 18 19 20 21 22 23 |
SELECT [deqp].[query_plan], WaitsXML.value('(event/action[@name="sql_text"]/value)[1]', 'VARCHAR(MAX)') AS [sql_text], WaitsXML.value('(event/action[@name="database_name"]/value)[1]', 'VARCHAR(MAX)') AS [database_name], WaitsXML.value('(event/action[@name="session_id"]/value)[1]', 'VARCHAR(MAX)') AS [session_id], DATEADD(MINUTE, DATEDIFF(MINUTE, GETUTCDATE(), GETDATE()), WaitsXML.value('(event/@timestamp)[1]', 'DATETIME2')) AS [event_time] , WaitsXML.value('(event/data[@name="node_id"]/value)[1]', 'BIGINT') AS [node_id], WaitsXML.value('(event/data[@name="thread_id"]/value)[1]', 'BIGINT') AS [thread_id], WaitsXML.value('(event/data[@name="cpu_time_us"]/value)[1]', 'BIGINT') / 1000 AS [cpu_time_ms], WaitsXML.value('(event/data[@name="total_time_us"]/value)[1]', 'BIGINT') / 1000 AS [total_time_ms], WaitsXML.value('(event/data[@name="actual_rewinds"]/value)[1]', 'BIGINT') AS [actual_rewinds], WaitsXML.value('(event/data[@name="actual_rebinds"]/value)[1]', 'BIGINT') AS [actual_rebinds], WaitsXML.value('(event/data[@name="actual_execution_mode"]/text)[1]', 'VARCHAR(MAX)') AS [actual_execution_mode], WaitsXML.value('(event/data[@name="actual_rows"]/value)[1]', 'BIGINT') AS [actual_rows], WaitsXML.value('(event/data[@name="actual_batches"]/value)[1]', 'BIGINT') AS [actual_batches], WaitsXML.value('(event/data[@name="io_reported"]/value)[1]', 'VARCHAR(MAX)') AS [io_reported], WaitsXML.value('(event/data[@name="actual_logical_reads"]/value)[1]', 'BIGINT') AS [actual_logical_reads], WaitsXML.value('(event/data[@name="actual_physical_reads"]/value)[1]', 'BIGINT') AS [actual_physical_reads], WaitsXML.value('(event/data[@name="actual_ra_reads"]/value)[1]', 'BIGINT') AS [actual_ra_reads], WaitsXML.value('(event/data[@name="actual_writes"]/value)[1]', 'BIGINT') AS [actual_writes] FROM [#RunTimeStats] OUTER APPLY [sys].[dm_exec_query_plan](WaitsXML.value('xs:hexBinary((event/action[@name="plan_handle"]/value)[1])', 'VARBINARY(64)')) AS [deqp] ORDER BY WaitsXML.value('(event/@timestamp)[1]', 'DATETIME2'), WaitsXML.value('(event/data[@name="node_id"]/value)[1]', 'BIGINT'), WaitsXML.value('(event/data[@name="thread_id"]/value)[1]', 'BIGINT') |

13 Comments. Leave new
The link to “Added per-operator level performance stats for Query Processing” is broken.
This just means I have to get more into Extended Events…….
Thanks Erik for the information.
By the way, the link to the MS post is broken.
Thanks for letting me know. Link should be fixed now.
Great post, thank you! The “Information Society” graphic isn’t clickable, should it be? It isn’t very readable currently.
Fixed!
“I wanna know…. what you’re thinking…. there is some things you can’t hide…
I wanna know… what you’re feeling… tell me what’s on your mind…”
Ahhhh, nothing like the nostalgia of 80s New Wave bands….
(Information Society reference for those not in the know)
I think there’s code missing here as there’s no #RunTimeStats temp table to query and even after I’ve read the events file into a temp table with that name I still get an error with “Waits XML”.
Dan, check if you’ve imported your extended event file data into a table using the name “WaitsXML” instead of “event_column” (default name) for 4th column (according to the default ordinal position). Also, verify if your column datatype is XML, if it’s not, just change it using an “alter table alter column” comand. It worked for me.
@Brent, thank you very much for this post. It really helped me.
No problem Jimmy! Glad you liked it.
Great post as usual. Something I think that is worth mentioning that wasn’t clearly stated. If you create a query_thread_profile event session it will enable the extended stats collection server wide – similar to as if you enable global trace flag 7412. In the example above the event session_id was filtered to 55; however, that doesn’t mean the extended stats collection is only turned on for that one session_id. This becomes pretty evident if you query sys.dm_exec_query_profiles and start seeing data from a bunch of other session_id’s that you weren’t tracing.
Ah, good call. I’ll update the post in a bit.
“More trouble coming every day?” Do I see a play on a Frank Zappa and the Mothers of Invention from their first album?
Kerry — I don’t think so. I was referencing this song, though admittedly I don’t know the whole history of it.