
When I ask you how fast your car is, there’s a two common metrics for answers:
- How fast it can go
- How much horsepower or torque its engine can deliver
If I ask you how hard your car is working right now, you’d probably answer with:
- Its current speed (in MPH or KPH)
- Its current engine workload (in RPM)
Conveniently, these two numbers are shown front and center on most car dashboards:

For SQL Server, those numbers are:
Current speed: Batch Requests per Second – the number of queries your server is currently handling. It’s available via Perfmon counter, and it’s on the dashboard of most monitoring software.
Wait Time per Core per Second – wait stats is the technique of measuring how much SQL Server is waiting on. You can’t tune wait stats using percentages – instead, you have to look at the total amount of time involved.
Compare these two five-second moments in the life of a SQL Server:
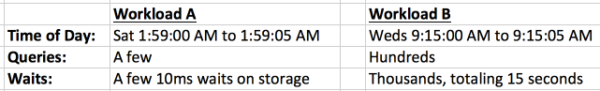
It’s clear that in Workload A, nothing is going on. Sure, 100% of our waits are on storage, but we don’t really have a storage problem. If Workload A was a car, it would be rolling along at 1mph, waiting for the driver to hit the gas pedal.
In workload B, there’s much more going on – but do we have a performance problem yet? That’s not quite as clear. To get the real picture, I have to tell you how many cores the server has.
Let’s Use Wait Time Per Core Per Second
Waits over time don’t really give you a clear picture – you have to divide the workload by the number of cores you have. Let’s say they’re both running on a VM with 8 virtual cores:
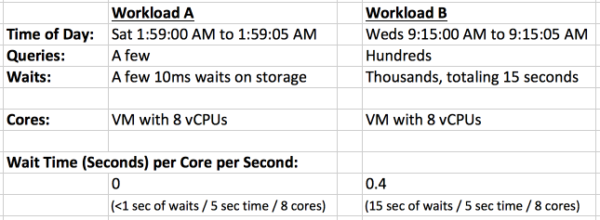
The VM on the left isn’t doing any work. It’s coasting.
On the VM on the right, for every second on the clock, each of its cores is spending .4 seconds (400 milliseconds) waiting on something (disk, memory, locks, etc.) While that might sound significant at first, it’s still really not doing any hard work. It’s not unusual for each core to spend several seconds per second waiting on different resources – and that’s fine, because SQL Server’s schedulers are good at switching over and running other queries that don’t need to wait.
For example, say you fire off a big SELECT query that scans a huge table, and we have to go get a lot of data from disk to accomplish it. That query’s tasks can wait for dozens (or hundreds or thousands) of milliseconds while other queries get their work done.
That’s why to measure SQL Server workloads, I’m proposing a new metric: Wait Time per Core per Second. That one metric, by itself, is a lot like the tachometer on a car’s dashboard. It’s not a measurement of how powerful your car is, but it does tell you how hard your car is working at this moment in time.
sp_BlitzFirst® now gives you this metric.
We’ve added new key metrics to the default output, including Batch Requests per Second, and Wait Time per Core per Second:

Note the new output down around priority 250-251 – it helps you get a fast idea of whether the SQL Server is working hard right now, or hardly working.
You can download our First Responder Kit with sp_BlitzFirst® now, and in our training classes, I show you more details on how I use it to triage real-world performance emergencies.

23 Comments. Leave new
Still one problem: If you are running 100 queries concurrently each waiting on the same data to be read you accumulate 100 wait seconds per wall clock second. Dividing by the number of cores does nothing good here.
Plug in a different number for “100” and you can make the metric look as good or bad as you want. The problem is exactly the same each time, though: The disk is saturated.
What do you think of measuring disk utilization (“highest active time” or whatever it is called) instead of disk-based waits?
Tobi – you’re absolutely right in that this one metric doesn’t get you to root cause analysis. It only gives you a relative measure of how hard a server is working.
I think you’ll find that most shops will use a different quality of disk subsystem for a server with 4 cores than they would a server with 64 cores. You might not be that kind of shop, and if that’s the case, I’d totally understand your concern.
Thanks!
Since downloading version 14 wait time per core per second as been 0 on a particular server every time I’ve checked throughout the day and night….. Can I infer that this server is way underutilized?
Also, the URL’s for batch requests per sec and wait time per core per second is https://www.brentozar.com/go/measure which are redirected to you home page, where the post is currently located. Was this the intended behavior?
Excellent post, but one quick clarification; you say “It’s not unusual for each core to spend several seconds per second waiting on different resources” did you mean ” … to spend several milliseconds per second waiting …”
David – thanks! No, I mean whole seconds. Think about a core that has dozens of queries stacked up, each of which is waiting on different reads from storage.
“SQL Server’s schedulers are good at switching over and running other queries that don’t need to wait” – so I found that measuring context switching per second gives a good metric on “current engine workload”. Funny, but this metric per core is close compared to the half of RPM of a car engine, since SQL Server feels “overheated” already near 4000 switches on average.
Here is sample code:
DECLARE @tmp TABLE (cpu_id INT, context_switches_count INT)
INSERT @tmp (cpu_id, context_switches_count)
SELECT cpu_id,-SUM(context_switches_count) context_switches_count
FROM sys.dm_os_schedulers
GROUP BY cpu_id
;WAITFOR DELAY ’00:00:01′
INSERT @tmp (cpu_id, context_switches_count)
SELECT cpu_id,SUM(context_switches_count)
FROM sys.dm_os_schedulers
GROUP BY cpu_id
SELECT cpu_id,SUM(context_switches_count) context_switches_count
FROM @tmp
GROUP BY cpu_id
WITH rollup
Waht do you think?
Thank you for this article. Much helpful.
Your scripts are awesome, but we have problem with one of them. The parameter “Wait Time per Core per Sec” for our SQL server is always 0. But in the same time we have more than 400 RPS. How we must understand it?
Oleg – I’ve never heard RPS before, but I’m going to assume it means requests per second. Let’s say you have 400 queries that finish within 4ms, and everything they need is in memory, and there’s no waits to access anything. Bingo, that’s 0 wait time.
Can you explain why I am getting negative values for wait time per core per second?
Also we get this
CXPACKET For 29 seconds over the last 5…
Batch Requests per Sec 0
Wait Time per Core per Sec 0
How can we have 0 in both when there are 29 seconds of CX_Waits?
John – the typical reason is that you’ve got lots of cores. Say you sampled for 5 seconds, and you had 32 cores. 5 x 32 = 160, so if you had 29 seconds of waits, that would round down to 0.
Hi,
If I have a server with 8 cores and I run a workload in 30 diff sessions in ONE minute.
The delta values I got in workload interval from sys.dm_exec_procedure_stats column total_worker_time was 189808259 (microseconds)
So, in ONE Second Wall clock, I spent ((189808259/1000000 change to second = 189.8)/60 change minute interval to second )/ 8 core = 39% of utilization in each core ?
complementing: 39% of utilization in each core in this very second wall clock!
Will – I don’t use that DMV for this. Try reading the post again where I explain how to do the measuring. Thanks!
Oh yes!!! I know.
I’m just saying if this way I said could be another way to measure that. Right ?
Thanks
No clue – I use the method explained in the post. If you have to ask if your method is right, then maybe you shouldn’t be using that method. 😉
Hi Brent
Quick question on the “High CPU Utilization – Not SQL” message that is output by Blitzfirst. If I have multiple instances on the same server can this metric be pointing to other instances using up CPU aside from the one I am running Blitzfirst on?
Thanks
Great question! Yes, absolutely – to SQL Server, all other apps (including other instances, or SSAS/SSIS/SSRS) are other processes. If you see “High CPU Utilization – Not SQL”, that’s a great example of why I don’t recommend instance stacking. Troubleshooting is such a pain in the rear.
Thanks Brent, just wanted to be sure. And yes, 9 instances so far with maybe more to come. Not what I recommended either but approach was to fire a load of Memory and plenty of cores with Always On. Working ok so far but none of the instances are all that busy. Thanks again for all the great work!
Hi Brent. Correct me if I am wrong but you didn’t seem to answer John’s question:
“Can you explain why I am getting negative values for wait time per core per second?”
I am also seeing quite a few negative values.
Thanks. Charles.
Hi! For support on sp_BlitzFirst, hit the readme file that comes with it. It explains where to ask support questions. Cheers!
Seems quite a number of your images are broken & unable to link, not just here, other pages aswell