
I love free tools. I also love analyzing SQL Server’s wait statistics. But I’m not a fan of Activity Monitor, a free tool in SQL Server Management studio, which helps you look at wait stats.
Activity Monitor just doesn’t give you the whole truth.
I fired up a workload with HammerDB against a test SQL Server 2014 instance. My workload runs a query that’s very intensive against tempdb, and it’s really beating the SQL Server up by querying it continuously on seven threads.
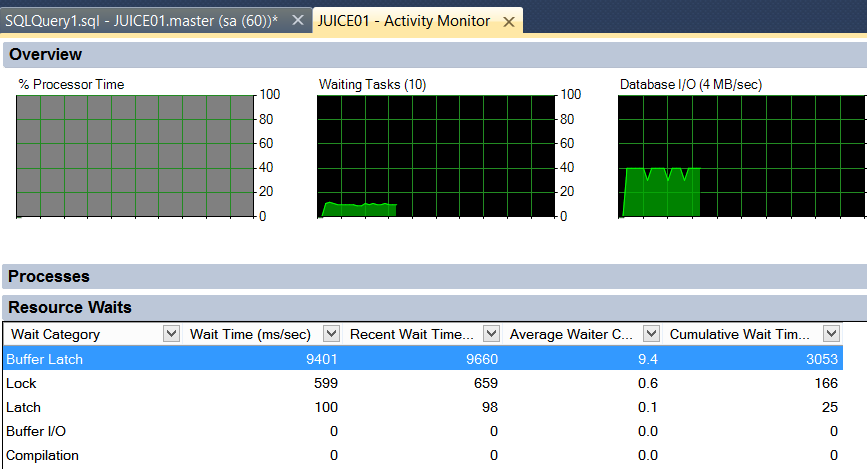
Let’s look at our wait statistics. Here’s what Activity Monitor shows in SQL Server 2014:
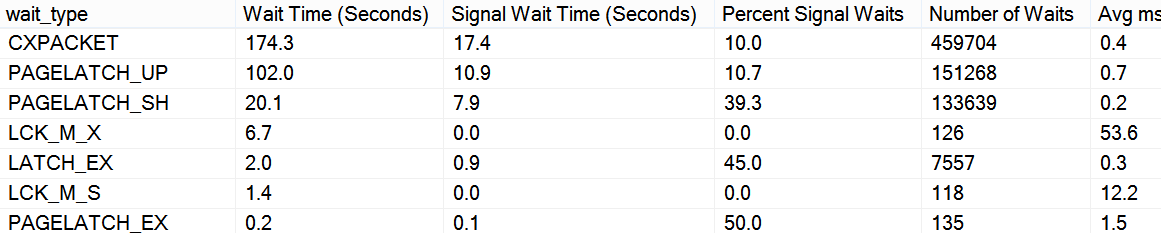
Here’s what our free procedure, sp_BlitzFirst shows for a 10 second sample while the workload is running. I ran: exec sp_BlitzFirst @ExpertMode=1, @Seconds=10;
Here’s what Adam Machanic‘s free procedure, sp_WhoIsActive, shows for an instant in time during the workload. I ran: exec sp_WhoIsActive

Let’s compare.
Activity monitor groups wait types. It took a whole lot of waits and rolled them up into ‘Buffer Latch’. This isn’t necessarily a bad thing, but I’ve never heard of documentation that explains what’s rolled up into which groups. By comparison, sp_BlitzFirst showed me the specific wait types PAGELATCH_UP, PAGELATCH_SH, and PAGELATCH_EX, with the amounts for each one. sp_WhoIsActive even showed me the type of page that is having the bottleneck (GAM) and the database and data file (tempdb’s data file 1).
Activity monitor leaves out wait types. sp_BlitzFirst showed that in aggregate, my #1 wait was CXPACKET over the sample. That tells me that a lot of my queries are going parallel. That’s not necessarily a bad thing, but it’s important for me to know that about my workload at the time. It helps me know that I want to learn more, and make sure that the right queries are going parallel. (In this case, the query that’s going parallel is pretty cheap, and is just as fast single threaded. My throughput goes up dramatically if I adjust the Cost Threshold setting up a bit.)
Friends don’t let friends use Activity Monitor. It may be convenient, but it doesn’t tell you the truth. Do yourself a favor and use a free tool that gives you wait statistics straight up.

22 Comments. Leave new
Recently had a developer leave this open for over a day. Not only did it drag the server, but he ended up blocking himself from expanding tree items in the GUI.
And then there’s the FREE, Ignite tool that I’ve found extremely useful, and educative. You have to hunt for it down the bottom of SolarWinds’ Free Products list, but it’s worth it. Using, particularly, the WAIT analysis it performs over a rolling hour, we’ve identified and solved a huge number of slow-running queries for many different WAIT causes.
I have NO connection with SolarWinds BTW, so this isn’t a product plug, merely a freebie-plug.
What is the name of the software you’re speaking of? I perused SW’s site and only found one free product for database analysis/management, named Database Monitor.
That’s the NEW name SW gave it. When you download, it’s Ignite_f_8_3_407_setup.exe, as of last week, that is.
If you click the download button, you register (it’s easy to unsubscribe) and you’ll see a product image that shows, at top left, “Ignite”.
I have it watching 5 servers on 3 different domains from one webpage. Must admit that some of the language in the setup pages is “different”, for an accidental DBA like me, but it’s worth wading through. SQL Login for the ignite_repository (SQL Database on a dev server), I think I took the defaults, but used sa just for the install, and you assign the strong password.
I think that experienced DBAs prefer monitor the activity of SQL Server via T-SQL commands and dynamic management views/functions. Activity monitor is just for beginners.
I think beginners end up using it, just because they don’t have a way of knowing about other things. But I think it’s harder for a beginner.
But I think sp_WhoIsActive is more intuitive for a beginner. Most people can see pretty quickly, “This is what’s running, sorted by how long.” And the wait types are easier to search on because they haven’t been renamed and categorized and had some things removed. It gets right to the point.
So, I would like to speak in Activity Monitor’s defence. I think that as long as you are aware o
Its limitations, it is a good basic tool to give you that mile-high overview of what’s going on in a particular SQL Server instance. I agree that it should NOT be used as the definitive too for rooting out performance issues and I ageee there are much better tools out there…
If you were ever a Unix sys admin, I think you relate to the anology of the vi editor. The best thing you can say about it is “It’s always there”.
Acting as Defense Council for Activity Monitor will be Ian Miller! 🙂
I can see your point also applying to sp_who2.
Except vi/vim editors aren’t just basic tools when it comes to Unix tools that are “always there”. After all those years they are superior compared to a lot of younger editing/programming tools.
Of course they aren’t very intuitive for people used to GUI and mouse only, like in that very true joke:
– what’s the best random character generator?
– windows user with task to exit vi/vim.
But after a while, when you get beyond basic shortcuts and configuration, You are getting powerfull and very fast tool that is hard to replace.
To expand on this a bit, sp_whoisactive works very well as part of an automated monitoring solution. Capture wait stats, active processes, get a look back in time to see what was slowing things down last night or last week.
http://realsqlguy.com/servers-youre-sleeping/
“Friends don’t let friends use Activity Monitor” I live by that statement. I give ugly looks to those that say look at it in Activity Monitor…
Most senior level resources rarely rely on canned tools, external or native. Most of us like the idea of controlling what we are seeing at a very granular level. I like Randal’s script for wait stats and sp_whoisactive is the single best free tool there is. Now, I’m not neglecting all of the incredible scripts written by those here, just that I use sp_whoisactive every single day… on every single machine. This combining of wait stats isn’t helpful and often times confusing for those new to waiters. Many third party tools do this also. I have clients that use Ignite. If you have a chance check out the sundry wait types on an Ignite instance and see if anything jumps out. Now, you’ll have to know the basics of wait stats but if you do, it will jump out at you. Hint… it will be one of the top waits and will be the only one that isn’t a true wait stat at all.
did anyone ever find the right answer to Mike’s question ??
What question?
I use activity monitor sometimes, but I find that when I need it most it fails me. I had some developer write a bad query that SQL Server estimated was going to return 1009360000000000 rows and fill up tempdb. Since activity monitor requires tempdb it was failing while I was trying to find issues. I don’t have access on this server to install sp_whoisactive since I am only a developer myself, so I ended up using sp_who2 to find stuff to kill.
The screen shot for the sp_BlitzFirst results is broken (for me). Could you have a quick look? Link points to http://2cqznbs0ua3adth82a3e1a15lq-wpengine.netdna-ssl.com/wp-content/uploads/2014/12/sp_BlitzFirst.png which displays a “Website not found” when I try to load the pictures separately.
Sorry about that, fixed!
one of our developers switched it on in search of his bad performing queries we found in the top of a top50 most resource consuming queries.
now he left AM running apparently and after 500 excecutions it settled itself in the top50 at place 2 aiming for better
me: “switch AM off”
developer: “my queries are fine now”
Hmm.. so AM does not provide detailed (“correct”) information about wait statistics and this makes it a “bad” tool… It is a strange argument. Yes, I am a developer who likes to use AM for a quick (!) overview and sometimes it is a convenient to see things in dynamics (“real time”) and not analyzing “static” logs. As with any tool, you need to know what it is good for and how to use it. In the end, the AM output it based on the same information which is available via more detailed system views. But it just makes it easy to check it (re-fetches data, presents graphically, gives quick access to execution plans…). And yes, I am not saying there are no better tools than AM, but it does not prove that AM should not be used.
I’ll rephrase what you said: “A hammer can pound screws in. I’m not saying there aren’t better tools, but that doesn’t mean I shouldn’t use a hammer to pound a screw in.”
I would disagree.
Sorry for tagging on an old thread. I do see more recent replies!
I’m very new to AM. Our Cloud Services team pointed me to it to show “excessive SQL” being executed. And that it does show. I’ve been mostly focused on the Recent Expensive Queries section. It often shows various sets of SQL statements executing at incredibly high executions per 10 seconds. These are not parameterized queries and have hard-coded, very specific constraints. Long story, but it does NOT seem likely that these counts can be accurate. I’ve assumed they are, but any possible source eludes me (and the rest of the team).
I went looking to see if this count can be trusted. Is it condensing queries with the same form but different constraint values (string GUIDs for example)? Or is it trying to tell me that 33k of the exact displayed query executed with the exact same values? Again, hard to believe.
It’s a busy PROD system so finding a tool to help monitor activity was a great find. From what I’ve read here, I’ll go ISO others. My main question here is: Can the Execution Rate reported by this tool be trusted?
Howdy! Make sure to read the post, especially the closing paragraph.