
Finding the worst queries in SQL Server is easy, right? You just query one of the dm_exec_* DMVs, bring in the SQL text and the execution plan, and then you spend hours looking at execution plans trying to figure out what’s wrong in the query, much less how to fix it.
All that’s changing – we’re introducing sp_BlitzCache®.
Life Should Be Easy
We try to make things easy for you. sp_Blitz® and sp_BlitzIndex® make life easy – they find help you find configuration and indexing problems. sp_BlitzFirst® helps you find problems that are hitting your SQL Server right now. We decided to take it one step further and apply our expertise to analyzing the plan cache.
There are a lot of queries that will help you get data out of the plan cache. A lot of those queries are also fairly complicated. They present a lot of data, but they don’t help you interpret the results.
Work Just Got Easier
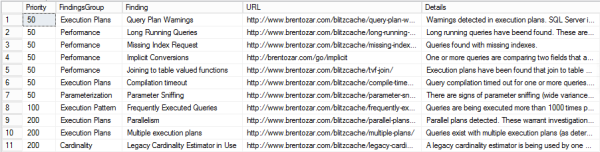
sp_BlitzCache® analyzes the top poorly performing queries for many different problems. After finding your bad habits, sp_BlitzCache® builds a list for easy analysis. Your bad habits are outlined in a summary result set:
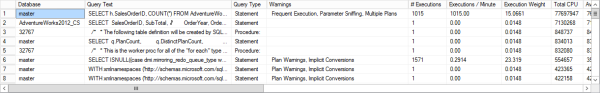
In addition, each of the queries in the top 50 worst performers will have their warnings called out in a separate warnings column:
Options
There are a number of different options available with sp_BlitzCache®. If you want a refresher, just run EXEC sp_BlitzCache @GetHelp = 1. Otherwise, here’s a quick overview:
@GetHelp – Displays a summary of parameters and columns.
@Top – Determines the number of records to retrieve and analyze from sys.dm_exec_query_stats, sys.dm_exec_procedure_stats, and sys.dm_exec_trigger_stats.
@SortOrder – CPU, reads, writes, etc. This controls collection and display.
@UseTriggersAnyway – Don’t set this unless you’re crazy. SQL Server 2008R2 and earlier has a bug where trigger count can’t be trusted. It seemed safer to ignore triggers on those versions of SQL Server than give you bad information.
@Results – There are three ways to display the detailed results grid. * Narrow will only display averages for CPU, reads, writes, and duration. * Simple, the default, displays totals and averages. * Expert displays all of the information collected by sp_BlitzCache in addition to metrics normally displayed.
If you want to save the results to a table, you can use @OutputDatabaseName, @OutputSchemaName, @OutputTableName to persist the results to a table. If the table doesn’t exist, it’ll be created for you.

40 Comments. Leave new
Very nice, clean and easy to understand. Another sp_blitzsomething to add to the admin database!
I tried it on a VM with 2 cores and 8GB memory for the instance (SQL 2008).
Total Cache plan size: 2441.42 MB
It took sp_Blitzcache 2.29 min (default settings) to finish and it drove the CPU cores from an average around 8-10% up to 50-60%.during this time.
So it is maybe not something to run in production during office hours 😉
Thanks guys for providing another great tool that makes DBA’s around the world look good.
Tried it on a Physical, 16 core machine. 3,5GB plan cache.
One of the cores peaked to 100%, but the average % cpu (all cores) hardly went up.
No problem..
But if you run it on a weak 2-core VM with a couple of GB’s of plan cache it looks like it will drive
CPU up around 50% during the minute or two of running sp_Blitzcache. Tried a couple with the same result.
Correct. XML processing in SQL Server is single threaded.
The larger the execution plans in the cache, the more time this will take to process them. Like all things, there’s a trade off.
All decisions comes with a trade-off. sp_BlitzCache™ has some CPU load due to the analysis. If you run this on a 2-core VM, that implies you both do and don’t care about performance.
Addressing your first comment, I suspect there’s an underlying problem with that 2-core VM either due to CPU constraints on the host or within the VM itself – on a single core VM, this only takes 19-25 seconds to run. On a server with a considerably larger plan cache, this still runs in ~30 seconds.
Yes, strange that it runs for so long. Gotta look at that.
Other similar VM’s do perform as you say.
Stopped caring about vm cores since CPU ready time and sp_blitzindex 😉
Anyway, sp_BlitzCache is superb. Helped me find a parameter sniffing issue today.
Does it work in SQL Azure? It seems Azure has disabled so many sp_ functions that very few scripts I find online will actually run.
Jerry – I admire your ambition! Most folks would have just copy/pasted in the script to their environment and tried it, but you instead took the time to write out an entire comment and wait for someone else to reply. That’s incredible! My hat is off to you, sir.
Sigh. Okay I spent the 10 minutes to do it, and just so others know, the answer is that sp_BlitzCache is NOT supported on SQL Azure.
10 minutes? It took you 10 minutes to copy/paste a stored procedure into SSMS and run it? Wow, SQL Azure has gotten even slower than I thought! That’s horrible to hear, man. No wonder you want to performance tune it. Definitely sorry to hear that.
Don’t have to be an asshole, when someone asked a valid question, which Jeremiah did not bother to answer in his post.
I like your website and read your newsletter, but I don’t like assholes. You’re an asshole.
Let the record show that I approved this comment rather than deleting it. 🙂
Wow. Even at this erudite site can we see a thread devolve into a monkey-poo-flinging exercise.
Lighten up, Ville. Some folks’ humor detectors need calibration.
None of us are as terrible as all of us 😉
And this is why I love coming to the site…. 🙂
The only things stopping this from running are the lack of
sys.configurations, which is used to gather the cost threshold for parallelism. Since Azure is single-threaded (LOL), it’s not needed for Azure testing – you can’t have parallel plans because your database is a Motorola RAZR.The blocker is that Azure does not support
sys.dm_exec_plan_attributeswhich is used to find out all kinds of awful things about your execution plans. There are two places where it’s easy to remove, but you lose checks for forced parameterization and cursors. The other placesys.dm_exec_plan_attributesused is to get the database name in the display of plans. Since you only have one database in Azure, this isn’t absolutely necessary, but the code changes would take time.I’ve set up a feature request to track this, but I don’t know when or if it’ll happen – it depends on the number of people who want it to happen and it adds to the long term maintenance.
Thanks Jeremiah–that was a much better response than Mr.Ozar’s.
Very cool Jeremiah. Only took me 28 seconds against a 5188.507812 MB plan cache, and with no impact. I’m totally adding this as one of my administrative checks.
Can we assume that a queries displayed with a blank entry for the warning column are not bad?
Another great utility from the Ozar Unlimited team. Thanks
It’s more that sp_BlitzCache™ hasn’t found any warning flags in the query itself. The query may still need some tuning, but there’s nothing in it that we are specifically checking for.
That being said, I’ve got 20-30 more checks to add 😉
LOL, …at least 29 with a final check for AWESOME.
Seriously though, this is a cool way to get information on the plan cache. My previous methods involved a few stitched up scripts and a lot more reading, but sp_BlitzCache has presented the information in a much clearer format. One step closer to becoming king sized http://upload.wikimedia.org/wikipedia/en/5/55/King-Size_Homer.png
Nice tool, Jeremiah. It not only caught my awful plans, but a couple from the tempdb and msdb internals too.
Funnily enough, in v2.2 I’ve added a flag to ignore system databases that will be enabled by default. Most people use master as their DBA tools database (probably because people like me default to
USE master;). It will exclude queries originating in master, model, msdb, tempdb, and resource – not because we don’t want to know, but because we can’t do anything.You should see how awful the system procedures look when you’ve got an instance of SQL Server that you only use for development and writing demos!
As far as I can see, there is a bug in implicit conversions detection. The code is:
WITH XMLNAMESPACES(‘http://schemas.microsoft.com/sqlserver/2004/07/showplan’ AS p)
UPDATE #procs
SET …….
implicit_conversions = CASE WHEN QueryPlan.exist(‘
//p:RelOp//ScalarOperator/@ScalarString
[contains(., “CONVERT_IMPLICIT”)]’) = 1 THEN 1
WHEN QueryPlan.exist(‘
//p:PlanAffectingConvert/@Expression
[contains(., “CONVERT_IMPLICIT”)]’) = 1 THEN 1
END
….
“p:” is missing before “ScalaOperator/”- should be:
WITH XMLNAMESPACES(‘http://schemas.microsoft.com/sqlserver/2004/07/showplan’ AS p)
UPDATE #procs
SET …….
implicit_conversions = CASE WHEN QueryPlan.exist(‘
//p:RelOp//p:ScalarOperator/@ScalarString
[contains(., “CONVERT_IMPLICIT”)]’) = 1 THEN 1
WHEN QueryPlan.exist(‘
//p:PlanAffectingConvert/@Expression
[contains(., “CONVERT_IMPLICIT”)]’) = 1 THEN 1
END
…
You are correct! I’ve fixed this in the development version which is nearly ready to ship, so hopefully this should get out to the public in the next week or two.
Thanks for that fix!
This is probably the single most useful script that I’ve come across – very insightful! Great work guys.
Thanks
Thank you! I am glad that it’s helping you out so much.
I ran sp_BlitzCache with no params this morning on a production 128-GB-RAM server, hosting a single SQL instance, taking up most of that server memory. I have about 5 databases with a total data size of 800 GB.
Took about 13 minutes to complete, running on one CPU, as Jeremiah mentioned in the webcast.
No blocking, no interference with any business processes.
Gave me a wealth of info, including recommendations for a stored procedure I was asked to tune yesterday, which was suffering from a few of the “sins” in the 1st result set. 🙂
Thank you for this very valuable tool,
Marios Philippopoulos
Would love to see a brief description of how the @only_query_hashes parameter that was added in v2.3 can be used. It currently is not described on the main sp_BlitzCache page. For example, what’s the best way to get all the query hashes for a specific stored procedure?
What a fantastic idea. I’m on it!
Is there a way to focus the results on a particular database on an instance? I have about 30 databases on an instance and I want to see data for columns like %Executions, CPU Weight, %Duration, etc. calculated for the queries in the single database I am trying to troubleshoot.
There is currently no way to focus on a single database. There’s a suggestion to add this feature over at http://support.brentozar.com/forums/250742-general/suggestions/6397628-filter-cache-by-database-name.
If you’d really like to see it, chime in on that issue about how you’d prefer that this happen and cast your vote.
I just tried to download your legacy sp_BlitzCache for 2005, but your link above doesn’t work and now goes to your training in person screen. Please could I get a copy?
Muchos Gracias in advance
Hi Steve,
That script is available in our download back of all the goodies. It’s named ‘sp_BlitzCache for SQL 2005.sql’. Here’s the link: https://www.brentozar.com/first-aid/sql-server-downloads/
Thanks for pointing this out, I’ll update the post to be clear about the new home!
Kendra
when i run sp_blitzcache with the parameters below to a table i get double the number when though i specified top 20
EXEC dbo.sp_BlitzCache
@top=’20’,
@sort_order = ‘CPU’,
@results = ‘expert’,
@output_database_name = ‘sql_txnUtil’,
@output_schema_name = ‘dbo’,
@output_table_name = ‘BlitzCache_CPU’
But when i just run the proc without the output parameters i get top 20.
EXEC dbo.sp_BlitzCache
@top=’20’,
@sort_order = ‘CPU’,
@results = ‘expert’
Please let me know what im doing wrong
Thanks in advance
Olu – hi! For support questions, head over to http://support.brentozar.com. Thanks!
Could you change:
EXEC sp_BlitzCache @GetHelp = 1
to
EXEC sp_BlitzCache @Help = 1
thanks!
hi,any help i tried to downloaded but cant why???
any help please
Samer – sorry to hear that! Go to our site and click Tools at the top of the page. From there, you can either register or log in, and on that page, after you log in, there’s a link to download the zip file.
Hello
How would I go about getting sp_BlitzCache to show me the decoded information for implicit conversions? As in this link…..
https://www.brentozar.com/blitz/implicit-conversion/
Thank you
Derek – just run the current version of sp_BlitzCache. There’s a column for implicit conversions.
Thanks Brent – Was still running an older version of the procedure
The Query Text in the results of sp_BlitzCache is showing a create statement for a trigger and a create statement for a stored procedure. I’m assuming the stored proc/trigger isn’t getting created the number of times in the #Executions column, it’s just being called that number of times, correct?