

Sometimes I run into a query plan that just shocks me. It’s like looking up and suddenly seeing an adult dressed as a squirrel riding a unicycle down a busy city street. You have to stop and ask yourself, “Did that really just happen?” (I live in Portland, Oregon, so yeah, I’ve seen that.)
A while back I blogged about how to write a query to demonstrate a big memory grant against the AdventureWorks2012 database. The trick was to stuff the query’s joins full of functions so that the query optimizer became baffled about how many rows might come out of the join. The query is terrible, but it’s useful for demonstrating some problematic situations with memory on a test server.
Recently I dug out the query to set up a demo on SQL Server 2014 and something strange happened: it saw through the awfulness of my query. It made my horrible TSQL fast.
Let’s feed my terrible query to SQL Server 2014
First, make sure the new cardinality estimator will be used for your query. You do this by setting the database compatibility level to 120:
|
1 2 |
ALTER DATABASE AdventureWorks2012 SET COMPATIBILITY_LEVEL=120; GO |
Now we’ll run this terrible, awful, no good query:
|
1 2 3 4 5 6 7 8 9 10 11 12 13 14 15 16 17 18 19 20 21 22 23 24 25 26 27 28 29 30 31 32 33 34 35 36 |
SELECT e.[BusinessEntityID], p.[Title], p.[FirstName], p.[MiddleName], p.[LastName], p.[Suffix], e.[JobTitle], pp.[PhoneNumber], pnt.[Name] AS [PhoneNumberType], ea.[EmailAddress], p.[EmailPromotion], a.[AddressLine1], a.[AddressLine2], a.[City], sp.[Name] AS [StateProvinceName], a.[PostalCode], cr.[Name] AS [CountryRegionName], p.[AdditionalContactInfo] FROM [HumanResources].[Employee] AS e INNER JOIN [Person].[Person] AS p ON RTRIM(LTRIM(p.[BusinessEntityID])) = RTRIM(LTRIM(e.[BusinessEntityID])) INNER JOIN [Person].[BusinessEntityAddress] AS bea ON RTRIM(LTRIM(bea.[BusinessEntityID])) = RTRIM(LTRIM(e.[BusinessEntityID])) INNER JOIN [Person].[Address] AS a ON RTRIM(LTRIM(a.[AddressID])) = RTRIM(LTRIM(bea.[AddressID])) INNER JOIN [Person].[StateProvince] AS sp ON RTRIM(LTRIM(sp.[StateProvinceID])) = RTRIM(LTRIM(a.[StateProvinceID])) INNER JOIN [Person].[CountryRegion] AS cr ON RTRIM(LTRIM(cr.[CountryRegionCode])) = RTRIM(LTRIM(sp.[CountryRegionCode])) LEFT OUTER JOIN [Person].[PersonPhone] AS pp ON RTRIM(LTRIM(pp.BusinessEntityID)) = RTRIM(LTRIM(p.[BusinessEntityID])) LEFT OUTER JOIN [Person].[PhoneNumberType] AS pnt ON RTRIM(LTRIM(pp.[PhoneNumberTypeID])) = RTRIM(LTRIM(pnt.[PhoneNumberTypeID])) LEFT OUTER JOIN [Person].[EmailAddress] AS ea ON RTRIM(LTRIM(p.[BusinessEntityID])) = RTRIM(LTRIM(ea.[BusinessEntityID])); GO |
Shazam, it finishes using only 63 ms of CPU time. It asks for a 27MB memory grant and estimates 290 rows (quite accurately).
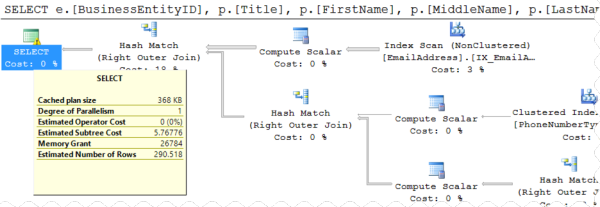
The execution plan contains warnings that “Type conversion in expression … may affect “CardinalityEstimate” in query plan choice”, but wow, it really did a remarkably good job with this!
Using OPTION(QUERYTRACEON 9481) to test Compatibility Level 110
You can go back to the old cardinality estimator with SQL Server 2014 in two ways: You could change the whole database’s compatibility level back to 110 like this:
|
1 2 |
ALTER DATABASE AdventureWorks2012 SET COMPATIBILITY_LEVEL=110; GO |
But that changes it for everything in the whole database. We might just want to see how THIS query would behave using the old cardinality estimator, but still on SQL Server 2014. You can do that by adding OPTION(QUERYTRACEON 9481) to the very end of our gruesome query:
|
1 2 3 4 5 6 7 8 9 10 11 12 13 14 15 16 17 18 19 20 21 22 23 24 25 26 27 28 29 30 31 32 33 34 35 36 |
SELECT e.[BusinessEntityID], p.[Title], p.[FirstName], p.[MiddleName], p.[LastName], p.[Suffix], e.[JobTitle], pp.[PhoneNumber], pnt.[Name] AS [PhoneNumberType], ea.[EmailAddress], p.[EmailPromotion], a.[AddressLine1], a.[AddressLine2], a.[City], sp.[Name] AS [StateProvinceName], a.[PostalCode], cr.[Name] AS [CountryRegionName], p.[AdditionalContactInfo] FROM [HumanResources].[Employee] AS e INNER JOIN [Person].[Person] AS p ON RTRIM(LTRIM(p.[BusinessEntityID])) = RTRIM(LTRIM(e.[BusinessEntityID])) INNER JOIN [Person].[BusinessEntityAddress] AS bea ON RTRIM(LTRIM(bea.[BusinessEntityID])) = RTRIM(LTRIM(e.[BusinessEntityID])) INNER JOIN [Person].[Address] AS a ON RTRIM(LTRIM(a.[AddressID])) = RTRIM(LTRIM(bea.[AddressID])) INNER JOIN [Person].[StateProvince] AS sp ON RTRIM(LTRIM(sp.[StateProvinceID])) = RTRIM(LTRIM(a.[StateProvinceID])) INNER JOIN [Person].[CountryRegion] AS cr ON RTRIM(LTRIM(cr.[CountryRegionCode])) = RTRIM(LTRIM(sp.[CountryRegionCode])) LEFT OUTER JOIN [Person].[PersonPhone] AS pp ON RTRIM(LTRIM(pp.BusinessEntityID)) = RTRIM(LTRIM(p.[BusinessEntityID])) LEFT OUTER JOIN [Person].[PhoneNumberType] AS pnt ON RTRIM(LTRIM(pp.[PhoneNumberTypeID])) = RTRIM(LTRIM(pnt.[PhoneNumberTypeID])) LEFT OUTER JOIN [Person].[EmailAddress] AS ea ON RTRIM(LTRIM(p.[BusinessEntityID])) = RTRIM(LTRIM(ea.[BusinessEntityID])) OPTION(QUERYTRACEON 9481); |
Retesting the query with the old cardinality estimator… Ouch! The query uses 84,109 ms of CPU time and the execution plan is back to a world of confusion, thinking it’s going to have to handle a kazillion rows:

Hey there new cardinality estimator, I’d like to get to know you better.
I’m not saying the new cardinality estimator will be better at every query, that it won’t have any regressions, or that you should start putting functions around all your joins.
But it’s pretty remarkable when the optimizer takes code that you wrote to be as terrible as possible, and suddenly makes it fast. Sign me up for more of that.

33 Comments. Leave new
Joe Sack covered the new CE at #SQLSaturday in Madison – quite interesting to say the least. I can’t believe it’s the first major update to the CE engine since the 7.0 days! The one takeaway I got from his presentation was the last sentence on the last slide (as you too alluded to): “If you don’t have time to test, don’t enable the new CE in production until you have.” While the vast majority of performance should improve, there undoubtedly will be some portions of your workload that will benefit from the old CE.
I’m always a fan of testing, but just as a counterpoint: doing a full code regression isn’t a simple task, and there are some applications with a higher tolerance of risk than others.
The fact that you can use trace flags with QUERYTRACEON to control the behavior of certain queries to use the lower compatibility level (or higher) is a great thing, and I think it’ll make the transition less difficult for many people than, say, the transition from compat 80 to higher levels. Man, that wasn’t fun.
I agree – the biggest issue (one of many) was with the use of NOLOCK w/out WITH. Many developers used the old syntax and all heck broke loose when I changed the compatibility level one fine day. At least it was in Dev 😉
Hi Allen – Can you elaborate on what you saw in regard to the NOLOCK hints? We have a lot of that here and a lot with out WITH. Thanks!
Hey – really interesting post!
Has anyone come across any information on how the CE actually manages to pull this off?
How can it know how many matches will be found between *nested* function calls on *both* sides of a join? I guess using basic information on typical correlation between tables?
I’m sure its quite elegant when you know the trick, but at the moment it seems indistinguishable from magic! 😉
Best Regards
S
I haven’t really looked. Honestly, I assume it actually IS magic.
If that’s not the case, it may be revealed in an upcoming whitepaper by the SQL Server product team (referenced here: http://blogs.msdn.com/b/psssql/archive/2014/04/01/sql-server-2014-s-new-cardinality-estimator-part-1.aspx)
In previous versions of the cardinality estimator, SQL Server punted on this estimation and it used some wildly bad guesses about the number of rows being returned out of the function.
In terms of estimating cardinality, a nested scalar function call is no different than a single function call. Mathematically speaking, f(g(x)) is the same as z(x) as long as z(x) does the same thing – nesting function calls in an RDBMS is no different as long as the result of one or more built-ins does the same thing.
The advantage SQL Server 2014 has is that it immediately punts to using hash joins instead of merge and nested loop joins. I’m not sure why SQL Server 2014 uses merge or nested loop joins with the terrible estimates that it makes. (Note that UDFs don’t behave in the same way because they are pure evil.)
There really are two things at play:
1) The Cardinality Estimator is making much more accurate estimates about the rows being returned.
2) The Query Optimizer is making much more interesting guesses about how to deal with these potentially poorly estimated data sets.
With the choice of a hash join, SQL Server can take advantage of a number of
As far as figuring out the trick, I suspect you’d want to start your search by looking for papers coming out of the University of Wisconsin’s computer science department and/or Microsoft Research.
Chengkai Li’s Set Predicates in SQL: Enabling Set-Level Comparisons for Dynamically Formed Groups looks like it might be a great start, but some of the other research is in a for pay article Testing cardinality estimation models in SQL Server.
That second paper makes reference to a faster/more improved join model estimation when the CE assumes that all distinct values from the child table are contained in the parent set. It seems to me that SQL Server may have this simple join model optimization built in, but that’s just speculation.
Are UDFs in 2014 still as bad as they use to were? Specially table-valued UDFs (and table variables as well) in which CE is awful and performance degrades as soon as more than just a few rows are returned?
Thanks
The problem with any UDF is that it’s not a physical object – it’s a function. Therefore there is no data to create histograms or statistics on – they are a black box from a cardinality estimation perspective. If you are returning a lot of rows from a UDF and joining to it, etc. – you can safely assume it won’t perform very well.
I’m sure others may be able to add more.
I know… And it’s a big mess when you realize too late, in a heavily loaded production database 🙂
Just wondering if there were some other kind of magic for UDFs in SQL 2014.
Thank you!
Adam Machanic demonstrated a really cool way to trick the query optimizer at SQL Saturday 291 in Chicago a couple weekends ago. You can find the scripts in his blog: http://sqlblog.com/blogs/adam_machanic/. I think his method could be used to make the query optimizer consider a more realistic number of rows returned from a UDF.
Simon – if you really want to read up on CE, as I mentioned in my other post Joe Sack has quite a few detailed blog posts on the topic.
Thanks matey – just reading through them now. The slide deck that Joe uploaded looks like information gold dust at the moment – at least until the MS whitepaper comes out.
Cheers
S
This is an example where 2014’s CE makes things better, but we’ve got an example where it makes it worse.
We have a statement which works just fine on SQL 2005, 2008, 2008R2 and 2012 (and 2014 with “OPTION (QUERYTRACEON 9481)”) but which grinds to a halt on 2014. i.e. from a second or two to nearly 2 minutes.
Has anybody else experienced a worsening of performance in 2014? We’re considering what to advise customers when they upgrade their servers to 2014.
Oh, absolutely people have had results where it hasn’t been better. For any application, you want to test it carefully before turning it on, and you might want to only enable or disable it for specific queries.
Ha! In my case a simple query (much simpler than the example above) went from 0 seconds to 20 minutes. Because the new estimator seems to think that doing 2000 full table scans on 400K rows is a very fast operation. The estimated operator cost for it went from 9.8 with the old approach to 0.18. And the magic trigger that makes it go crazy seems to be an OR in your WHERE clause. Remove the OR and it regains its senses. Might be a bug. Microsoft rule of thumb seems to be still working: never use a Microsoft product until the first service pack release.
Oh, wow, that’s interesting! As for SP1, unfortunately it had major problems in SQL Server 2012. So…. yeah, I’m not sure that rule is “safe” unfortunately.
2014 is ridiculous so far. Smallest possible query is slowing down compare to 2008 R2 for no reason. same hardware, same everything and same reads. I am good at query tuning but this is not normal. AM I missing somethiing with 2014 ? I am not talking about 1 or 2 query – Every query on the server is increased by 100 ms or 500 ms. I am talking milli seconds so you can imagine how I have already tuned them. Anything will help. I am using standard edition.
Shailesh – troubleshooting your entire server is a little beyond what we can do in a blog post comment, but if you’d like personalized help, feel free to contact us. That’s exactly what we do for a living, actually!
I have had similar experience with 2014, where one query on a database with 2008 R2 compatibility performed badly until I either switched the compatibility level to 120.
But then another important query ground to a halt which was working fine when the compatibility was 2008 R2.
Running the second query with trace 9481 sorted the second query but since I applied it at the server level, the first one slowed down. (Unfortunately the code is auto generated and the client has no control over it so we couldn’t use the OPTION(QUERYTRACEON 9481).
In the end I tried switching both 2312 and 9481 traces on ….. and magically it actually worked on both kind of queries.
Not sure if I can explain why or how… but it worked!!
USE [master]
ALTER DATABASE [QADB1] SET COMPATIBILITY_LEVEL = 120
GO
DBCC TRACEON (2312, -1)
DBCC TRACEON (9481, -1)
GO
Check out Brent’s post here, this may explain it: https://www.brentozar.com/archive/2015/06/careful-testing-the-2014-cardinality-estimator-with-trace-flags/
If that’s the explanation, then your fix probably isn’t stable, unfortunately.
We recently migrated some databases from a 2012 server to a 2014 server and one in particular had serious slow queries. All of this had been working fine on the 2012 server. CPU use was at a constant 25% on the new server, and certain queries were taking > 30 seconds and causing application timeouts. We switched back to 2012 mode and everything started working. We saw CPU drop to 5% almost immediately, and it’s stayed there since.
I tested out a couple of the queries that we could ID as being specific problems on our load test system set back to 2014 mode, and by adding OPTION(QUERYTRACEON 9481), we saw the same improvement as switching to 2012 mode.
I don’t want to set the traceflag at the instance level, because there are other DB’s which don’t have problems. Instead, we are working through all the queries and seeing where applying OPTION(QUERYTRACEON 9481) makes sense and will then set back to 2014 mode once we can get them all updated.
In our case, the queries that had issues were of two types:
– Queries that have multiple self-joins on a key-value pair table (basically these are searches on multiple parameters).
– Queries that select from the key-value pair in a pattern like “WHERE Value=’X’ AND Key IN (1,2,3)”
Oddly in the 2nd case, we have a filtered index on Key, Value WHERE Value IS NOT NULL. Under the new cardinality engine, SQL was sometimes unable to determine that it could use that index, but sometimes it would. Often we’d see suggestion to add an index on Value, Key. Under the old engine, it never had any issues that we noticed.
In 2016, I am having issues with sqlpackage.exe that runs this SELECT
SELECT * FROM (
SELECT
SCHEMA_NAME([o].[schema_id]) AS [SchemaName],
[si].[object_id] AS [ColumnSourceId],
[o].[name] AS [ColumnSourceName],
[o].[type] AS [ColumnSourceType],
[ic].[column_id] AS [ColumnId],
[c].[name] AS [ColumnName],
[si].[index_id] AS [IndexId],
[si].[name] AS [IndexName],
[ds].[type] AS [DataspaceType],
[ds].[data_space_id] AS [DataspaceId],
[ds].[name] AS [DataspaceName],
[si].[fill_factor] AS [FillFactor],
[si].[is_padded] AS [IsPadded],
[si].[is_disabled] AS [IsDisabled],
[si].[allow_page_locks] AS [DoAllowPageLocks],
[si].[allow_row_locks] AS [DoAllowRowLocks],
[sit].[cells_per_object] AS [CellsPerObject],
[sit].[bounding_box_xmin] AS [XMin],
[sit].[bounding_box_xmax] AS [XMax],
[sit].[bounding_box_ymin] AS [YMin],
[sit].[bounding_box_ymax] AS [YMax],
[sit].[level_1_grid] AS [Level1Grid],
[sit].[level_2_grid] AS [Level2Grid],
[sit].[level_3_grid] AS [Level3Grid],
[sit].[level_4_grid] AS [Level4Grid],
[sit].[tessellation_scheme] AS [TessellationScheme],
[s].[no_recompute] AS [NoRecomputeStatistics],
[p].[data_compression] AS [DataCompressionId],
CONVERT(bit, CASE WHEN [ti].[data_space_id] = [ds].[data_space_id] THEN 1 ELSE 0 END)
AS [EqualsParentDataSpace]
FROM
[sys].[spatial_indexes] AS [si] WITH (NOLOCK)
INNER JOIN [sys].[objects] AS [o] WITH (NOLOCK) ON [si].[object_id] = [o].[object_id]
INNER JOIN [sys].[spatial_index_tessellations] [sit] WITH (NOLOCK) ON [si].[object_id] = [sit].[object_id] AND [si].[index_id] = [sit].[index_id]
INNER JOIN [sys].[data_spaces] AS [ds] WITH (NOLOCK) ON [ds].[data_space_id] = [si].[data_space_id]
INNER JOIN [sys].[index_columns] AS [ic] WITH (NOLOCK) ON [si].[object_id] = [ic].[object_id] AND [si].[index_id] = [ic].[index_id]
INNER JOIN [sys].[columns] AS [c] WITH (NOLOCK) ON [si].[object_id] = [c].[object_id] AND [ic].[column_id] = [c].[column_id]
INNER JOIN [sys].[objects] AS [o2] WITH (NOLOCK) ON [o2].[parent_object_id] = [si].[object_id]
INNER JOIN [sys].[stats] AS [s] WITH (NOLOCK) ON [o2].[object_id] = [s].[object_id] AND [s].[name] = [si].[name]
INNER JOIN [sys].[partitions] AS [p] WITH (NOLOCK) ON [p].[object_id] = [o2].[object_id] AND [p].[partition_number] = 1
LEFT JOIN [sys].[indexes] AS [ti] WITH (NOLOCK) ON [o].[object_id] = [ti].[object_id]
LEFT JOIN [sys].[tables] AS [t] WITH (NOLOCK) ON [t].[object_id] = [si].[object_id]
WHERE [si].[is_hypothetical] = 0
AND [ti].[index_id] < 2
AND OBJECTPROPERTY([o].[object_id], N'IsSystemTable') = 0
AND ([t].[is_filetable] = 0 OR [t].[is_filetable] IS NULL)
AND ([o].[is_ms_shipped] = 0 AND NOT EXISTS (SELECT *
FROM [sys].[extended_properties]
WHERE [major_id] = [o].[object_id]
AND [minor_id] = 0
AND [class] = 1
AND [name] = N'microsoft_database_tools_support'
))
) AS [_results];
Using different options and traceflags we obtained very different execution times.
130 compatibility with 4199 traceflag : 1 minute 40 seconds
110 compatibility with no trace flags : 2 secondes
130 compatibility with 4199 traceflag and scoped QUERY_OPTIMIZER_HOTFIXES on and LEGACY_CARDINALITY_ESTIMATION off: 2 seconds.
So for this SELECT, if I want to stay in 2016 compatibility then I need this combination
130 compatibility
4199 traceflag
SCOPED QUERY_OPTIMIZER_HOTFIXES on
SCOPED LEGACY_CARDINALITY_ESTIMATION off
One thing I noticed is that the estimated rows was very low for the execution plan that took 1+ minute.
My question is this. In 130 compatilbity, traceflag 4199 turns off all hotfixes right? So if I activate query_optimizer_hotfixes on, doesn't that cancel 4199 ?
Very confusing
QUERY_OPTIMIZER_HOTFIXES is the equivalent of trace flag 4199.
One thing is sure, if I use the OPTION(QUERYTRACEON 9481) in the SELECT then the query is fast every time. Too bad I can’t add it to sqlpackage
Ha! Call that a gruesome query? I’ve seen worse!
We are going through the upgrade pains from SQL Server 2008 R2 to SQL Server 2017 – and came across this old, but useful post… As anticipated, we found some embedded SQL which is now running slow due to the new CE!
One tip to add: You can override the DATABASE SCOPED CONFIGURATION settings for specific bad queries, e.g.
SELECT col1, col2, col3
FROM tab1
WHERE col1 = ‘SLOW?’
— ** Override the CE setting **
— OPTION (USE HINT ( ‘FORCE_LEGACY_CARDINALITY_ESTIMATION’ )) — revert to old CE
OPTION (USE HINT ( ‘FORCE_DEFAULT_CARDINALITY_ESTIMATION’ )) — use new CE
;
Our DBA has mentioned that adding Trace flag -9481 and changing compatibility mode of SQL version to 2012 are not same. As per them, Trace flag works in server level and Compatibility works in DB level. Can you help me to understand the difference between both?
[…] article demonstrates the new CE very well, i can’t recomand it […]
Late to the party but here goes and it might only apply for some issues. I had similiar issues, after ugrading some queries performed terrible (sub second before, 70+ seconds after). After some basic checking I started looking much closer at the “Actual Rows” and “Estimated Rows” of all parts of the execution plan. They were more then a factor 1000 to 100.000 off. I updated statistics but to no avail. Until I updated the statistics that where used with a fullscan sample, everything snapped into position. Even better it went to millisecond territory. I updated statistics again without the fullscan and the executionplan reversed back to the 70+ second plan. What was happening here? These queries are on large tables with 100 million plus rows. Doing a update statistics with no specified sample, triggers sql to guess an appropiate sample, that guessed sample for large tables can be less then 1%. Turns out that sample was not representative for the overall dataset in our case, execution plan and performance went off the rails because of it. It was fixed by specifying larger sample sets on specific statistics updates and persisting them ; although persistent_sample_percent can be referted back to 0 with an index rebuild unfortunately; (persist 0 means sql guesses the sample rate. Here’s a query to check on sample rates and if there are persistent samples:
select
S.name AS [Schema], O.name AS [Table], C.name AS [Column], St.name AS [Statistic],
filter_definition, last_updated, rows,
rows_sampled, steps, unfiltered_rows, modification_counter, shr.persisted_sample_percent,
(rows_sampled * 100)/rows AS sample_percent
from sys.schemas S WITH (NOLOCK)
INNER JOIN sys.objects O WITH (NOLOCK)
on S.schema_id = O.schema_id
INNER JOIN sys.stats St WITH (NOLOCK)
on O.object_id = St.object_id
INNER JOIN sys.stats_columns StC WITH (NOLOCK)
ON St.object_id = StC.object_id AND St.stats_id =StC.stats_id
INNER JOIN sys.columns C WITH (NOLOCK)
ON C.object_id = StC.object_id AND C.column_id = StC.column_id
CROSS APPLY sys.dm_db_stats_properties(sT.object_id, sT.stats_id) shr
where O.is_ms_shipped = 0
Moral of the story, the guessed sample rate by SQL may be too low.
Was this all really from five years ago?
In our case, we did quite a lot of work to make the most obviously “fast in 2012, slow in 2014” parts of our application “fast in 2014”. But having done that we did a more general performance test and found that 2014 was generally slower everywhere so regretfully took the decision to implement “SET LEGACY_CARDINALITY_ESTIMATION = ON” from 2016 onwards.
Is there any suggestion that the new CE is in some way tailored for optimal performance in a certain “type” of data / database? By “type” I mean data volumes, distribution, etc. or perhaps types of operation.
Not that I’ve seen, no.
the new CE improves the perfomances of 95% of the query, the improvement I measured is 10% on average, but let’s talk abouth that 5% of queries that slow down, their performances drop by orders of magnitude