
Memory is one of the most-used resources in SQL Server. Generally, the more you have, the better query performance you’ll get. This blog isn’t about the magic of the buffer pool or the plan cache, but you should understand how important they are to your server’s performance. Since memory is such an important resource, you want to know how much of it you’re using at any time.
How can you track your server’s memory usage? One way is to use the Performance Monitor (Perfmon) counters exposed through the sys.dm_os_performance_counters DMV. One indicator of memory performance is Page Life Expectancy (PLE). You can capture basic memory usage over time by setting up a SQL Server Agent job to query this DMV, inserting the results into a table, and reporting on the table results.
I’ll show you how to collect this data and report on it!
Collecting the Data
I have a “DBAInfo” database on my instance that I use to track metrics and other information. I create a new table, MemoryHistory.
|
1 2 3 4 5 6 7 |
USE DBAInfo; CREATE TABLE MemoryHistory (ID INT IDENTITY NOT NULL, CollectionDateTime DATETIME, PerfmonObjectName NCHAR(128), CounterName NCHAR(128), CounterValue BIGINT) |
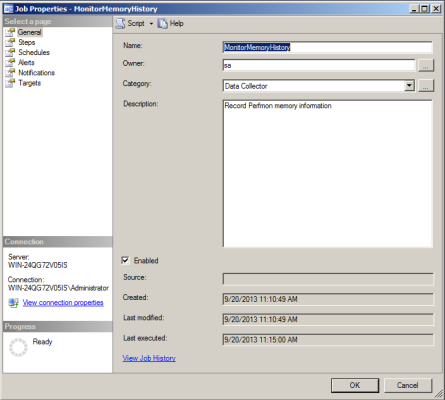
Then, I create a new SQL Server Agent job that runs every 5 minutes.
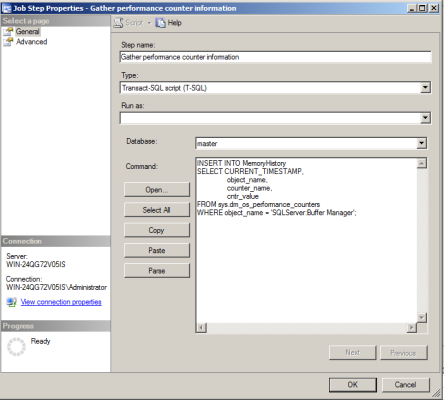
The only step in this job is the below query, which queries the DMV and inserts the results into the table I created.
|
1 2 3 4 5 6 7 |
INSERT INTO MemoryHistory SELECT CURRENT_TIMESTAMP, object_name, counter_name, cntr_value FROM sys.dm_os_performance_counters WHERE object_name = 'SQLServer:Buffer Manager'; |
I schedule the job to run every five minutes.

Viewing The Data
Now, this data isn’t going to do me any good unless I view it, and make a decision or perform an action based on what I learn.
To view the data I’ve collected, I run the following query:
|
1 2 3 4 5 |
SELECT ID, CollectionDateTime, CounterName, CounterValue FROM MemoryHistory; |

That’s a lot of junk to sort through when all I want to see is PLE, so I narrow down the query a bit.
|
1 2 3 4 5 6 |
SELECT ID, CollectionDateTime, CounterName, CounterValue FROM MemoryHistory WHERE CounterName = 'Page life expectancy'; |

But who wants to read through results like that each time there’s a problem to see when PLE rose or fell? Not me. I’d rather see it in a graphical format. How can I do that?
SQL Server Reporting Services
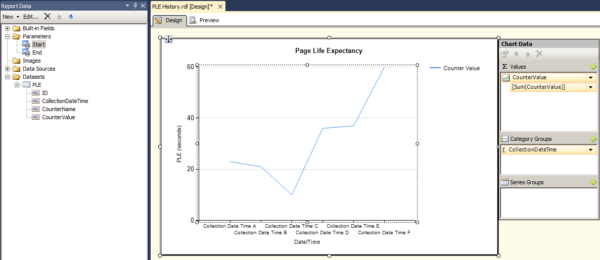
I have SSRS at my disposal. I’m going to create a very simple report that will allow me to enter start and end dates, and will display a line chart for PLE during that time.
Reporting on the Data
I set up my report to have DBAInfo as my data source. In order to choose dates, I use the following query as my dataset.
|
1 2 3 4 5 6 7 8 |
SELECT ID, CollectionDateTime, CounterName, CounterValue FROM MemoryHistory WHERE CounterName = 'Page life expectancy' AND CONVERT(DATE, CollectionDateTime) >= @Start AND CONVERT(DATE, CollectionDateTime) <= @End; |
I change my @Start and @End parameters to “Date/Time” so I get a date picker.
I drag a Line Chart onto the design surface and add the CounterValue as my Value and CollectionDateTime as my Category Group.
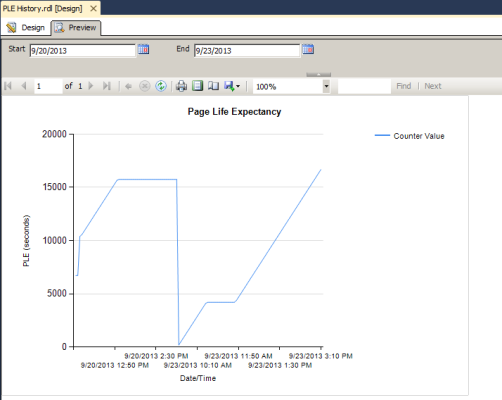
I can preview the report to view it:
Last but not least, I’ll deploy this report to Report Manager so that I and others can run it, or even schedule a regular subscription.
Homework
There are several ways to improve this report. How can you modify the query to capture date and time data individually? How do you add parameters to the report so the user running it can choose their own date range? How would you collect and display data for different instances?

8 Comments. Leave new
object_namecolumn ofsys.dm_os_performance_countersincludes instance name so job’s first step can be something like[code]SELECT CURRENT_TIMESTAMP,
object_name,
counter_name,
cntr_value
FROM sys.dm_os_performance_counters
WHERE object_name = COALESCE(‘MSSQL$’ + NULLIF(@@SERVICENAME, ‘MSSQLSERVER’), ‘SQLServer’) + ‘:Buffer Manager’;[/code]
cheers,
Great stuff! I modified your code to monitor any counter by introducing a parameter @Counter
Server status data query:
Use DBAinfo
INSERT INTO MemoryHistory
SELECT CURRENT_TIMESTAMP, object_name, counter_name, cntr_value
FROM sys.dm_os_performance_counters
WHERE object_name like ‘%Buffer Manager%’;
Datasets:
1.Any counter
SELECT ID, CollectionDateTime, CounterName, CounterValue
FROM MemoryHistory
WHERE CounterName = @Counter
AND CONVERT(DATE, CollectionDateTime) >= @Start
AND CONVERT(DATE, CollectionDateTime) <= @End;
2.CounterNameList (for dropdown parameter @Counter)
SELECT DISTINCT CounterName
FROM MemoryHistory
ORDER BY CounterName
The chart title is made dynamic with an expression:
="Chart: "+Parameters!Counter.Value
Cool stuff – thanks for the input!
Jes,
How can you view data for multiple days? I’m using the following in my where clause but I can only view data for one particular day. I can’t span multiple days.
WHERE CONVERT(DATE, collection_datetime) = @Start
AND CONVERT(DATE, collection_datetime) = @End
Nevermind, I figured it out.
Cool, glad you did. For anyone else that might have the same question:
To get date ranges in queries, use WHERE Date >= @StartDate AND Date <= @EndDate.
your WHERE clause in the SSRS part is not SARGable, is it ok?
If you want to performance tune it, you’re absolutely welcome to. This is a starting point – we gotta leave you some work to do, right? If we did your entire job for you, you wouldn’t have a job anymore. 😉