
Storage vendors brag about the IOPS that their hardware can provide. Cloud providers have offered guaranteed IOPS for a while now. It seems that no matter where we turn, we can’t get away from IOPS.
What Are You Measuring?
When someone says IOPS, what are they referring to? IOPS is an acronym for Input/Output Operations Per Second. It’s a measure of how many physical read/write operations a device can perform in one second.
IOPS are relied upon as an arbiter of storage performance. After all, if something has 7,000 IOPS, it’s gotta be faster than something with only 300 IOPS, right?
The answer, as it turns out, is a resounding “maybe.”
Most storage vendors perform their IOPS measurements using a 4k block size, which is irrelevant for SQL Server workloads; remember that SQL Server reads data 64k at a time (mostly). Are you slowly getting the feeling that the shiny thing you bought is a piece of wood covered in aluminum foil?
Those 50,000 IOPS SSDs are really only going to give you 3,125 64KiB IOPS. And that 7,000 IOPS number that Amazon promised you? That’s in 16KiB IOPS. When you scale those numbers to 64KiB IOPS it works out to 1,750 64KiB IOPS for SQL Server RDS.
Latency vs IOPS
What about latency? Where does that fit in?
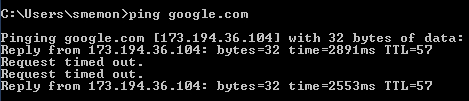
Latency is a measure of the duration between issuing a request and receiving a response. If you’ve ever played Counter-Strike, or just run ping, you know about latency. Latency is what we blame when we have unpredictable response times, can’t get to google, or when I can’t manage to get a headshot because I’m terrible at shooters.
Why does latency matter for disks?
It takes time to spin a disk platter and it takes time to move the read/write head of a disk into position. This introduces latency into rotational hard drives. Rotational HDDs have great sequential read/write numbers, but terrible random read/write numbers for the simple reason that the laws of physics get in the way.
Even SSDs have latency, though. Within an SSD, a controller is responsible for a finite number of chips. Some SSDs have multiple controllers, some have only one. Either way, a controller can only pull data off of the device so fast. As requests queue up, latency can be introduced.
On busy systems, the PCI-Express bus can even become a bottleneck. The PCI-E bus is shared among I/O controllers, network controllers, and other expansion cards. If several of those devices are in use at the same time, it’s possible to see latency just from access to the PCI-E bus.
What could trigger PCI-E bottlenecks? A pair of high end PCI-E SSDs (TempDB) can theoretically produce more data than the PCI-E bus can transfer. When you use both PCI-E SSDs and Fibre Channel HBAs, it’s easy to run into situations that can introduce random latency into PCI-E performance.
What About Throughput?
Throughput is often measured as IOPS * operation size in bytes. So when you see that a disk is able to perform X IOPS or Y MB/s, you know what that number means – it’s a measure of capability, but not necessarily timeliness. You could get 4,000 MB/s delivered after a 500 millisecond delay.
Although throughput is a good indication of what you can actually expect from a disk under perfect lab test conditions, it’s still no good for measuring performance.
Amazon’s SQL Server RDS promise of 7,000 IOPS sounds great until you put it into perspective. 7,000 IOPS * 16KiB = 112,000 KiB per second – that’s roughly 100MBps. Or, as you or I might call it, 1 gigabit ethernet.
What Does Good Storage Look Like?
Measuring storage performance is tricky. IOPS and throughput are a measurement of activity, but there’s no measure of timeliness involved. Latency is a measure of timeliness, but it’s devoid of speed.
Combining IOPS, throughput, and latency numbers is a step in the right direction. It lets us combine activity (IOPS), throughput (MB/s), and performance (latency) to examine system performance.
Predictable latency is incredibly important for disk drives. If we have no idea how the disks will perform, we can’t predict application performance and have acceptable SLAs.
In their Systematic Look at EC2 I/O, Scalyr demonstrate that drive latency varies widely in EC2. While these numbers will vary across storage providers, keep in mind that latency is a very real thing and it can cause problems for shared storage and dedicated disks alike.
What Can We Do About IOPS and Latency?
The first step is to make sure we know what the numbers mean. Don’t hesitate to convert the vendor’s numbers into something relevant for your scenario. It’s easy enough to turn 4k IOPS into 64k IOPS or to convert IOPS into MB/s measurements. Once we’ve converted to an understandable metric, we can verify performance using SQLIO and compare the advertised numbers with real world numbers.
But to get the most out of our hardware, we need to make sure that we’re following best practices for SQL Server set up. Once we know that SQL Server is set up well, it’s also important to consider adding memory, carefully tuning indexes, and avoiding query anti-patterns.
Even though we can’t make storage faster, we can make storage do less work. In the end, making the storage do less gets the same results as making the storage faster.

50 Comments. Leave new
Nice writeup, I also don’t want to see folks scammed by a single metric without context.
“It’s easy enough to turn 4k IOPS into 64k IOPS…”
Simply converting 4k IOPs to 64k IOPs by dividing by 16 does not account for important factors such as CPU/controller utilization, buffer utilization, and round trips. Its extremely important, for example, when using an on-board PCIe flash accelerator card to know the page size options and select the best one for the workload and system. There’s a current card that is formatted to 4k pages by default which allows 64k page formatting… many SQL Server workloads will perform far better with 64k pages. It’s also very important to evaluate whether a change to fibre channel HBA maximum transfer size will benefit performance. If SQL Server issues 1 mb IOs and the HBA splits them into 512k IOs… the extra round trips make a difference.
Thanks for the additional details.
I opted for the simple route since device manufacturers are the initial parents of lies and untruths. RAID stripe size, HBA transfer size, iSCSI packet size, and all kinds of other things can play a big part in IO performance.
Ha! I thought about this some more and realized that with a very reasonable assumption, you could simply divide a the vendor’s 4k IOPs number by 16 and come up with an estimated CEILING for the 64k IOPs, or perform other such simple conversions. The assumption is that the vendor would ONLY report the IOPs from the most favorable IOPs*IOsize combination.
However, it would be hard to predict how far below that ceiling a different IO size would land. And who knows… maybe there is a vendor that, when faced with significant differences among IOPs*IOsize combination, would actually report the whole story?
Actually, dividing 4kB random IOPS by 16 does not necessarily produce a meaningful ceiling estimate for 64kB random IOPS. On a pure-disk system, where disk seek latency is the primary limit on IOPS, that may be a reasonable assumption.
On ION’s SR-71mach4 all-SSD RAID server, we find that 4kB random reads execute at just over 1 million IOPS while 64kB random reads are performed at 131 thousand IOPS, or more than double what would be predicted when dividing by 16. In an all-SSD system doing that many random IOPS, the limit at 4kB is not the performance of the individual drives and certainly not “seek” time. The limit on performance for 4kB random reads is much more related to the performance of system processors and RAID controller processors. The result is that for random read performance, bandwidth (MBps), that is, IOPS * block size, improves significantly as block size increases.
IOPS are more about random seeks. For sequential reads the number is entirely meaningless. You get the same MB/s with any (reasonable) blocksize and therefore with any IOPS you want.
On a magnetic disk the 4k IOPS number will be very comparable to the 8k IOPS number because the disk seek makes for ~99% of the cost. The seek takes 10ms and the additional 4k read takes 4k/(100MB/s))=0,04ms (IOW nothing).
The model will be entirely different for each disk type and vendor. To make a decision you need to understand the model. This article however makes very broad statements which do not hold in general. This is really a nasty source for out-of-context quotes.
Hey Tobi, thanks for your contribution. I’m glad that you pointed out that to read 8K, I could spend 10 ms (or 99.6% of the duration) waiting on a drive head to move into position. It really is important that people know how long I/O could take in a worst case scenario.
In database applications, or really any application in a multi-user environment, can you tell me the last time you encountered purely sequential I/O?
Jeremiah: “In database applications, or really any application in a multi-user environment, can you tell me the last time you encountered purely sequential I/O?”
Yep. Database backup 🙂 To a lesser extent integrity checks and index maintenance. And to the least extent of these – SQL Server readahead and Oracle multi-block reads. Use startup option -E to alter SQL Server proportional fill behavior and you might just see a whole lot more sequential IO 🙂
Tobi: “IOPS are more about random seeks. For sequential reads the number is entirely meaningless.” For spinning media I agree with the first sentence. For flash if every IO passed to the device is same size as block/page, its usually a draw. For spinning media AND flash I disagree that IOPs are meaningless for sequential IO. A counterpoint is database backup. If IOPs were meaningless… Microsoft wasted time allowing a configurable max transfer size parameter for the T-SQL backup command… and I wouldn’t have had as much fun showing how increasing the fibre channel HBA max transfer size (thus lowering the number of IOPs for the backup) changed the behavior of SQL Server backup with respect to bandwidth and latency. 🙂
http://sql-sasquatch.blogspot.com/2013/07/mssql-backups-check-hba-maximum.html
Good points on your part.
My main point is: understand the execution model and you can predict performance. Without talking about a specific model I would not make specific statements.
In your article you made improvements after determining what affects the underlying IO size. That was a good approach. SANs and RAIDs can need high IO size because they stripe IOs over multiple drives so that physical IOs are a fraction of the requested IO size. Again, the model explains the observations and allows for making predictions.
And yes, IOPS are a scam 🙂 Glad someone is calling it out.
Depending on how the device work (for both HDD and SSD devices) doing 16x 4k reads and 1x 64k read might take significantly different amounts of time. Just multiplying to convert one to the other may well give you meaningless numbers.
Nice Article.
I would add that IOPS and Throughput measure different things. IOPS have a direct impact on an IO subsystem capability to hold concurrent IO request to the subsystem. IOPS are generally more relevant to system’s performance than throughput when a large number of database applications are hosted on a single subsystem : that is the case when physical consolidation increases . In such regard, the key factor of IO subsystem becomes a purely physical issue depending on the controller algorythmic’s ability to buffer effectively striped IO operations on the spindles. Traditional SAN vendors are now totally overwhelmed economically by the appearance of newt technologies which basically do much better for a much lower price.
So does the performance noticeably go up when you reformat a drive from default 4k to 64k or is it just that SQL uses the space more efficiently and it’s a ‘little’ better?
With some storage subsystems, I’ve seen as much as a 50% jump. With others (like NetApp or some SSDs) there’s been no difference.
You’ll get much more efficient I/O – when SQL Server performs one logical 64KB I/O operation, it’ll be one physical I/O operation too. Lining everything up with the correct formatting (check with your vendor) can make a huge difference – as Brent points out.
Hi 10x for this blog.
We have EMC with Fastvc, the Storage team want new Hardware and want plan form me.
the issue is i am working to decrease any IO oparation this days – so the business is up but the IOPS are down.
what shloud i do?
pini
Krisher – that’s a great question. A lot of our clients come to us for help building storage and hardware budgets. We’ve got a customized consulting product to help with that, and you can learn more by clicking Contact at the top of our site, or emailing us at Help@BrentOzar.com. (It’s tough to find folks who will help you build a hardware budget for free – although of course your vendors will be more than happy to do that for you, and you can guess that the budgets will be fairly high, hahaha.)
I agree completely that just IOPS, or just MBps or even just latency, is not very meaningful without context. To evaluate how meaningful a certain claim is, you really need to see the detail of IOPS AND MBps AND latency along with the context of block size and queue depth and a description of the storage system under test. Full IOmeter resulsts and a description of the hardware and software confiugration are a good start.
My company, ION Computer Systems, has a good amount of storage benchmarks posted, and they include am overview of the system along with block size, read and/or write. random or sequential and queue depth. And they include a link to the IOmeter detailed output for the test.
On more note, on SSD, or SSD RAID servers like ION’s SR-71mach4 server, another important aspect of “context” is the duration of the test and the warm up, or ramp, before the test. Disk-based systems can yield consistent results if run long enough to saturate the effects of the caches along the way. SSD-based systems need longer, hours under tests that include write, for the individual drives to reach steady-state performance.
I may have lost this in translation, but apparently looking at latency alone is not enough to gage disk performance… So I have to ask, What is a “qualitative” way of measuring performance of your SAN? What do I need to take into account?
You need to take a look at operations/sec, throughput, and latency. As Keith Josephson points out in a previous comment, you also need to be aware of block size and queue depth as well as the other other activity on the storage device.
In a perfect world, you would collect this information and look at the average, median, standard deviation, and a variety of percentiles in order to get an accurate understand of storage performance over time.
There’s some great information in the comments that will help you put together an assessment of your storage.
There are also several examples and samples over in our article How Fast is Your SAN?.
No metric should be taken without a grain of salt.
64K is a standard page size for SQL Server.
It’s not the case for other RDBMSes
It’s optimized for HDDs.
All current RDBMSs are tweaked to abuse sequential IO at the expense of random IO which has horrible performance on spinning media.
Now, if you consider an RDBMS that has been optimized for the performance pattern of solid state media, not only are you going to take full advantage of the stated burst 50K+ random IOPS, but you will also drop all the now inefficient spinning media tricks that make up most of the RDBMS storage layer for another speedup.
Having tested SSD with current RDBMSs I was very disappointed by the performance increase, but to be fair this is due to those tools being stuck in the spinning rust era, not to the SSDs not performing, as their raw performance is a measurable fact.
Ludovic – That’s interesting, sorry that you didn’t get the performance you needed. Have a great 4th, and thanks for stopping by.
It doesn’t matter how SQL Server wants to read blocks, all that matters is how the drive was formatted by the OS. If it was in 4K blocks, you get 16 IOPS in SQL Server, like it or not. And WTF is a KiB? And why would you use it right next to a MB? Stick to Counter-Strike and getting your latency down to a minimum, kid.
Hi “Butch”,
Thanks for your insightful and meaningful contribution to the world at large. They’re greatly appreciated!
Since you asked so nicely, a KiB is a kibibyte or 1,024 bytes. An MB is a megabyte or 1,000 KB or 1,000,000 bytes.
Keep living the dream!
Coming from the marketing side of an enterprise storage manufacturer (Tegile), how should we talk about storage performance? We can talk all day about reducing latency and increasing IOPS, but it seems like you really have to take a deeper dive and figure out how your database performance can be accelerated by a better storage architecture.
What kind of stats do you guys want to see from storage manufacturers that will help you make better decisions?
There are a few things I’d like to see from a storage vendor.
When I look at storage performance, I want to see performance numbers on a storage device configured for a SQL Server workload. In a perfect world, the storage would be set up according to your SQL Server best practices guide and the numbers reproducible using something like SQLIO or Crystal Disk Mark. From these test, I’m looking for realistic IOPS, latency at that particular queue depth, and throughput.
For tiered storage, it’s all well and good to show top tier performance, but demonstrating sustained throughput is even more important. This could be done with a longer SQLIO test where the data file is larger than the top tier, or it could be done with a large scale TPC test. The goal would be to see what we could expect from different size workloads and that also has the ancillary benefit if encouraging customers to size storage appropriately.
Frankly, that sounds a little strange – I, for one, don’t want to see “performance numbers on a storage device configured for a SQL Server workload”, as this is not an application I particularly care about. I just dont see storage vendors starting to built storage systems specifically for very application there is, Its rather another way around. But some standardized metric with accurate and clearly understood numbers would certainly help.
Why is it strange for a SQL Server professional to want to see how storage will perform when best configured for SQL Server? I don’t care how well it runs a web server or file server. I need to know how SQL Server performs on it. Changes to storage settings that make a difference are important to the final purchasing decision.
I only meant the question was posted by storage vendor asking what info is desirable to provide with storage solution. Im sure he did not mean specifically for SQL server. Asking hardware vendor to be application specific is not very meaningful to me – the IT world is much bigger than SQL server. If anything, vendor should provide none-application specific, standardized numbers that can then be taken into consideration accordingly by application specialist (SQL, Exchange, WEB, etc.).
I understand where you’re coming from. Remember where the question was asked – we’re SQL Server professionals talking about IOPS as they apply to SQL Server.
Most vendors provide information around general system performance and best practices guidance for multiple specific applications. It’s all there from the bigger vendors.
Year old but still relevant and useful article and discussion. Saying that, I hope its just me who don’t quite understand the topic completely. First, its not clear how is IOPS really defined – ‘operation’ by disk or by OS?
a. If by disk, it means that average SATA disk can perform ~60 IOPS and so your app is expected to be slower than if running on SAS disk doing ~120 IOPS. However, how much it helps in planning if we dont know how much data actually get transferred? OPS, latency, etc.., in the end the app speed will be defined by how much data on average are transferred to/from disk per unit of time. If 4KB is a unit of data transferred by disk in 1 IOP, then this is it.Should we assume that 1 IOP correspond to one movement of the disk head which is followed by 4KB block transfer up the controller to OS? Either way making SQL server (or any other app) read/write in 64KB blocks will still require 64/4=16 head jumps. So how is it faster?? The only ‘faster’ thing possibly would be issuing one instruction per 64KB by OS vs 16 instructions but its not related to the performance of the storage subsystem. Another thing that is reasonable to assume is that with 64KB SQL read/write the 64KB are written in adjusent sectors/clusters contrary to the case when SQL writes 4KB blocks that could get allocated more randomly (though I doubt it would happen too often).
So the question is how then 64KB formatting/reading can reduce IOPS requirement? It would still require disk to perform the same 16 IOP to transfer 64KB of data.
b. If IOPS is related to OS then its even more mind bending – in that case SQL server provides 64KB transfer per 1 IOP? So if next SQL generation switches to 128KB it will suck 2 times more data from the disk in a single OP? If for that the disk heads would need to move 2 times more then it does not really speed up the storage subsystem at all. Or how much data can really be read by disk in a single move?
So I am rather perplexed by this whole business of talking about IOPS when nowhere I can find what really it constitutes and what relates too.
Secondly, the same motif – in the beginning of the article we got these numbers – that for instance 7000 IOPS claimed by AWS are misleading (agree 100%) because they are measured in 16KB blocks (thats really good to know, at least something meaningful) which translates to 1750 IOPS for 64KB SQL per IOP.. I dont get it – if AWS does not provide IOP rate (16KB?) then the number indeed is simply meaningless. If they do then there is nothing misleading, on the contrary, its a good indicator as it (supposedly) is not app dependant. Whatever IOPS you calculate for your app it still will transfer the same amount of data per time unit. 7000 IOPS AWS = 1750 IOPS SQL = 112000KB. Which goes back to the questions I put earlier – whats really IOPS? Disk term, OS term or both? How we can equal AWS (=storage subsystem) IOPS and SQL (=aplication) IOPS? It looks to me that in this article you implicitly sticks with understanding that IOPS its still a disk term. So having to deal with 7000 AWS IOPS you are implying that it is a ‘true’ speed measure and so adjust SQL IOPS to equal AWS IOPS in sense of true data transfer speed. But then why even talk about SQL IOPS? It does not seem an indicator of anything (contrary to true IOPS which are a measure of disk performance).
Still another part of the same question – SAS IOPS are officially posted to be somewhere around 150 IOPS or so. Transfer rates also posted to be around 6GB (per sec?). Does it mean 40MB for 1 IOPS for SAS disk? Thats far cry from your stated 4KB.
Sorry for very lengthy comment but it is a complicated (if not outright messy) subject and Im afraid Im not the only one who does not understand it completely.
I have take a step back and ask what you’re trying to learn and where you’re trying to go with this knowledge. There’s a jumble of information in here and it sounds like you’re very confused on the subject and have received some misinformation and confusing guidance.
That being said, here goes:
IOPS stands for input/output operations per second. It’s measured by an application somewhere. In our case, that application is SQL Server.
You cannot assume that an IOP is a movement of a disk head followed by a 4KB transfer. An IOP is a request to read or write a datum of a specific block size.
Different applications issue I/O requests in different block sizes. SQL Server typically requests data in extends made up of 8 8KB pages (64KB). MySQL uses 16KB pages. Oracle is configurable, but defaults to 8KB. If SQL Server were to switch from using 8 pages per extent to 16 pages per extent, then twice as much data would constitute an IOP as SQL Server sees it.
By writing at a size that’s optimal for any given application, we hope to avoid logical fragmentation of the data. There’s no foolproof guarantee since the storage controller (or even the operating system) may perform out of order writes in order to achieve better throughput.
The AWS IOPS numbers are no more misleading than anyone else’s IOPS numbers – they tell you what size was used to measure the IOPS and the number of operations that were observed. Knowing this is important because it tells us what we’re guaranteed to get. Amazon chose the 16KB number because the bulk of their customers are running *nix systems and are likely using MySQL as a backing store for at least some of their data. To make matters more complex, it’s only AWS rotational storage that’s measured in 16KB IOPS. AWS SSDs (the new default) are measured in 256KB IOPS. IOPS + operation size give you a measure that you can use to relate to your workloads.
There are no hard and fast numbers for IOPS unless the vendor has promised you something. IOPS are used as a way to measure that vendor promise.
SATA or SAS is just the technology used as the data transport between the disk and the disk controller. Different versions of each technology promise different throughput numbers, those are measured in gigabits – not bytes. The transport technology has no bearing on the ability of a disk drive to serve up data. The SATA SSDs in my laptop are faster than rotational SAS drives.
Hope this helps clarify.
Thanks, Brent, for more detailed explanations.
As you ” ask what you’re trying to learn and where you’re trying to go with this knowledge” – I’m trying to find a good way to estimate which and how many disks I might need to ensure my application performs without disk been a bottleneck. For that I need to understand the meanings of performance metrics of the disks.
If “it sounds like you’re very confused on the subject and have received some misinformation and confusing guidance” that’s because I am and I did. Former because of the latter with mentioned guidance been various Internet articles, including this very one :-).
The main conclusion I got is that at least half of the authors don’t really understand what they are talking about as data/statements in half of the articles contradict data in the other half (which does not exclude case that all 100% don’t really understand the matter). The main problem starts with simple definitions – its meaningless to go into lengthy discussions when the very terms used are not clearly defined. And in this particular case the most important term, ‘operation’, is not clearly defined. Anywhere. (Im sure it is in some textbook or manufacturer documentation but I have neither). Defining what acronym ‘IOPS’ means (as everybody happy to provide) is not a definition of the important concept of the ‘operation’, that is what exactly is understood or what kind of action is described by the word.
I’m fine with the fact that “You cannot assume that an IOP is a movement of a disk head followed by a 4KB transfer”. More, I don’t even want to assume anything, I simply want to know what exactly the manufacturer or disk engineer describes (or measures) by ‘operation’. Without it all the discussions about performance characteristics of the disks are not worth the time spent on reading them, much less writing them.
So while kind of knowing what it is not I still am not sure what it is. Putting together all the facts I got so far though, it seems there are three possible explanations/definitions:
1. The ‘operation’ when applied to data transfers has two interconnected meanings – first, its a single request/instruction by OS to the disk to read a chunk of data (logical IO). And in the context of the disk activity the ‘operation’ is a single action performed by the disk (physical IO) as a response to the requests received. The two don’t need to be equal in terms of amount of data read (or written). That is OS can send two IO requests which could be combined by a driver or controller into a single ‘double’ request and generate a single physical disk IO operation. Further, physical disk operation does consist of a single physical action of the head getting on the track and reading requested amount of data. The faster disk rotates the faster the single IO will be (because of faster linear speed of the track). If to satisfy OS request the head needs to move over more than one track (like when data located close to the center of the platter) the IO operation takes longer. On OS side the logical IO is a single request to read a chunk of data of the whole dataset requested by user. That is user creates request to, say, read 64MB data set. Application, (say SQL server), creates 1000 IO, each of reading 64KB page. OS takes it and if file system is formatted with 64KB clusters, creates 1000 requests to the processor and then on to the disks to perform 1000 reads. Which disk is obliged to do. If file system is formatted with 4KB pages then OS creates instead 16,000 requests and disk performs 16,000 distinct IO to satisfy it. That’s 16 times longer than with 64KB clusters. Seems that’s what people claim to see when files system is formatted with 4KB clusters instead of 64KB for SQL server. That’s peachy but its just sounds awfully long – to read 64MB dataset for the ~100IOPS drive would take 10 sec with 64KB formatting and over 2 min with 4KB formatting. For a ingle user request. Don’t know about that.
But at least its consistent with the idea that disks capable of twice higher IOPS would read/write the same file twice faster than disks capable of two time less IOPS. And IOPS data provided by vendor are direct indication of the disk performance while at the same time its consistent with the idea that just IOPS number is now direct indication of application performance as data size read/write by disk single operation could vary.
2. Another meaning implied is that the ‘operation’ is a ‘user generated’ single action. That is if user instructs application to read a dataset, this is a single operation. Open 120KB email – one operation. Open 1MB file – one operation. The application then instructs OS to read a number of chunks of data – 120KB email generates a single operation (=instruction) to read four 32KB pages (in Exchange case) and then OS generates in a single batch an instruction to read two clusters (in case of 64KB formatted disk). Then disk performs a single operation consisting of reading two clusters of data. That’s one IO. The larger the dataset requested the longer it takes to complete IO but within certain limits (whatever they are) the time to complete IO is much smaller than time gap between two different IOs (which is translated to the ‘latency’). That meaning looks more consistent with some test results ( like here – http://www.thessdreview.com/featured/ssd-throughput-latency-iopsexplained/) that show that IOPS required differ depending on the size of the file read (if meaning ‘1’ was correct than size of the file should not matter – IO are still of the same size and take the same amount of time each). So in this case reading 10MB file (even fragmented) would be faster than reading 10 1MB files – one large operation is faster than 10 small ones as there is not latency introduced by switching from one IO to another. Of course, in that case it makes IOPS indicator even more ‘scammy’ as it will not help much in planning for application performance, overall throughput could be more useful. And seems also it would invalidate some of the arguments presented in this article – whatever cluster size or application read/write pages are makes no difference for the disk as it just reads the stream of data requested by OS in a single operation, contrary to the meaning ‘1’ formatting the drive with 4KB would not create 16 more IO for the disk, it would be the same.
Wow, I cant believe I wrote all this. Enough for a separate article. But the bottom line is only one of the two different definitions of the IO operation presented is true.
The only question is which one. So far the data I have collected over the Internet and my own personal experience show some contradictions to either. And, yes, the third definition – something which is neither of two presented but that I did not consider. And would not it be nice if somebody somewhere, maybe vendor or disk engineer simply defined what indeed they mean before telling their disk is achieving 180 IOPS or such? Until they do the IOPS numbers indeed are a scam.
Vadim – you were replying to Jeremiah, actually. 😉
If your business requirement is to find out how much storage you need, don’t focus on physical disk movements. Every storage vendor has different ways of abstracting read and write loads doing things like caching and tiering. Instead, work with the storage vendors you’re considering, and they’ll give you demo units to do load testing. That way you can find out whether they can sustain the loads you’re trying to accomplish.
Perhaps you could update this piece to include discussion of queue depth on performance. Taking that into consideration, it seems that using the simple 16 factor against 4K and 64K performance won’t be accurate.
I could, but that would be a test of storage systems, not a discussion about how the notion of an IOP isn’t a effective unit of measure of storage performance. I/O performance at different queue depths is more about the implementation of the storage controller and less about whether or not IOPS can help you measure storage. Many storage devices perform “better” at higher queue depths simply because they’re able to queue up reads and writes and serve them, potentially, out of order as perceived by the user but in an order that’s advantageous for the storage device itself.
Which all, largely, proves the point that your storage vendor’s measure of IOPS is not at all an accurate measurement, since they’ll pick the numbers that look the best for the gear you’re about to buy, not the most realistic numbers.
This discussion is flat out fascinating for a non-engineer who’s intrigued by how this stuff works. Even if I don’t understand all that’s here I feel ever so much smarter for having read it. Thanks to all who contributed.
So, would these results from a dual-controller SAN be considered fair, good, pretty good?
SQLIO test, 64K blocks. Random Reads = 4.4GB/sec sustained (“flatline, not some peaks from saw-tooth results”) Test platform was running multiple RAID6 sets, using 4TB data, all SSD of course. I don’t know anything about the server involved, or how much that’s a factor.
Hi Rick,
From a random read perspective, that sounds pretty good. Obviously, more details are needed to determine just how good that really is. The full details are over in Finding Your SAN Bottlenecks with SQLIO.
This is an older thread, but I think brings to light a really important and often overlooked aspect of SQL Server performance – storage system performance and the pitfalls of trying to measure it, especially toward trying to figure out how well it will perform SQL-centric I/O patterns.
If I could add a takeaway that I learned the hard way over years of just assuming that a big, bad blade with ridiculous stats is just going to pump that data like greased lightning, BENCHMARK your servers!
Before you even install SQL Server on a box you just got from your vendor, hook it up to a test bench and run SQLIO, Crystal Disk Mark, whatever. Try formatting at 64k, change RAID levels, stripe size, controller configuration. I learned so much about how these different things affect the actual speed and throughput attained from these tests, I wished I had started doing it much earlier.
If there’s any way possible to grab a server for a few days before anything but the OS is installed, it will change the way your servers (and their drives) are spec’d out for SQL Server, for the better, almost certainly. Just like the configuration settings in SQL Server itself, you need to understand what all these numbers and settings mean and *tune* your storage system to get the most out of it.
I agree completely!
Thanks for sharing, Bob.
Thank you very much for this awesome article, Jeremiah!
May I ask some questions regarding the topic? Here we go:
What about a shared storage that is not only used for SQL Server VMs, but for Exchange Server, File Server, etc. or maybe the entire company IT?
How should I configure the block size for that?
Another question I have is: Is there a relation between storage block size and for example ESXi datastore block size? Should both have the same block size?
Thanks in advance for your view on this.
Regards
Mark
Mark – your best bet is to check with your shared storage vendor’s best practices. It’s different for each make/model of SAN gear.
Hello Jeremiah,
Great Article, thanks for porting!
Noted the following:
“… 112,000 KiB per second – that’s roughly 100MBps. Or, as you or I might call it, 1 gigabit ethernet..”
As far as i knew 100mbps is still Fastethernet. Gigabit equals to 1000 mbps.
Am I wrong?
Cheers
Alessio
Alessio – check your caps. Mb/s is very different from MB/s. https://en.wikipedia.org/wiki/Data_rate_units
For hottest information you have to visit world-wide-web
and on internet I found this site as a finest web site for most up-to-date updates.
[…] Imagine que você precisa entregar 10000 IOPS. Consultando na documentação de Tamanhos das Máquinas Virtuais de uso geral, vemos que a DS3_V2 é uma candidata a suportar essa carga de trabalho, visto que o limite máximo dela é de 12800 IOPS. Porém como o tamanho de um bloco no SQL Server é de 64KB, precisaríamos teoricamente de uma banda total de 640 MBps para sustentar as operações de escrita e leitura. Olhando na mesma documentação, vemos que o tamanho da VM suporta 192 MBps. Brent Ozar já nos alertava sobre isso. […]
Wow awesome deep insights thank you so much! As a data architect/modeler I get called into tuning and would love to go this deep but what I really need is slightly more basic. Can you recommend a sight paper or provide a cheat sheet on how to check the unit of I/O transfer (block size) on; 1 an existing disk, 2 network connection 3 SQL server sub system 4 DBMS instance. How do I get a picture of the whole pipe sizing’s. If I can really push my luck the same target path for actual utilization assuming MS 10 or better and SQL server 12 or better?
Hi, would someone please help me to solve my problem?
I have 2 virtual machine , storage of first vm is sas raid 5, storage of vm 2 is ssd raid 10, i tested them with hd tune and diskspd and the result was this : vm 2 is at least 20 times faster than vm 1, i have my sqlserver on both vms, i run a query on both and the result is like this : vm 1 is twice faster than vm 1.
sorry for my bad english and thanks in advance.
Houman – for general questions, you’ll want to hit a Q&A site or forum, or hire a consultant.
Just wanted to throw in my 2 cents from practical experience. Some of our customers have the nicest SAN’s, with really high theoretical IOPS/throughput. However, they decided that potential dataloss is very scary and decided to put the same SAN in their second datacenter. Then they made the horrible decision to put it all in synchronous replication mode, because now you have no dataloss (lower risk, but no guarantees of course).
What happens is something nobody though about. The actual write performance of the SAN is now limited by the link latency. So you take your RAID10 setup with SSD’s, average response time 3ms for reads. Limiting your (single threaded) IOPS to 333. Which is in turn around 3% of the write performance. I know that for large sequential writes this is not really an issue, as with a block size of 8-16MB we are still talking about a few GB/s. But, for small random writes in a high OLTP database this can be certainly very bad. Updating many random rows with small changes will definitely be a lot slower.
We try for most of our customers with high performance needs to get dedicated hardware. I’d rather have a server with a RAID10 array of SSD’s than a VM with a SAN connected. We put such a server in an AlwaysOn Availability group with async replication. Sure, there is a potential dataloss and there is no automatic failover, but it is certainly a lot more performant (and we are no longer impacted by other servers/services that are resource/IO hungry).
I had overwritten part of my reply:
What happens is something nobody though about. The actual write performance of the SAN is now limited by the link latency. So you take your RAID10 setup with SSD’s, average response time <0.1ms. But now you need to cross the link twice (data transfer and the final ack back). Let's assume a link latency of 1.5ms. Limiting your (single threaded) IOPS to 333 (response time of 3ms). Which is in turn around 3% of the write performance. I know that for large sequential writes this is not really an issue, as with a block size of 8-16MB we are still talking about a few GB/s. But, for small random writes in a high OLTP database this can be certainly very bad. Updating many random rows with small changes will definitely be a lot slower.