
SQL Server needs to have a reasonably correct estimate of how many rows your query is going to handle. If it doesn’t, things can go terribly, terribly wrong.
Most often, the problem is that SQL Server under estimates its work. In this case, the query optimizer thinks it has just a little bit of work to do, but in actuality it has much more. This results in “undersized” execution plans for the task– frequently a tiny little nested loop that’s run through over and over again while a larger join would do much better for the workload. This problem is often found in relation to the Ascending Key Problem and out of date statistics in SQL Server.
But sometimes we have the opposite problem: SQL Server thinks it has a LOT of work to do, but really it only a little bit.
This pattern creates a totally different set of issues and has a very different impact on the workload of your SQL Server.
A simple trick to inflate row estimates
I’ve run into problems with workloads where overestimates are happening several times over the years, each time with completely different root causes. Recently I’ve found a simple way to reproduce the phenomena in AdventureWorks that makes it easy to see some of the impacts of overestimating a query’s work.
Let’s start by looking at the execution plan for the query behind AdventureWorks2012‘s [HumanResources].[vEmployee] view. We’ll run this and get an actual execution plan as well as IO statistics.
|
1 2 3 4 5 6 7 8 9 10 11 12 13 14 15 16 17 18 19 20 21 22 23 24 25 26 27 28 29 30 31 32 33 34 35 36 37 38 |
SET STATISTICS IO,TIME ON GO SELECT e.[BusinessEntityID], p.[Title], p.[FirstName], p.[MiddleName], p.[LastName], p.[Suffix], e.[JobTitle], pp.[PhoneNumber], pnt.[Name] AS [PhoneNumberType], ea.[EmailAddress], p.[EmailPromotion], a.[AddressLine1], a.[AddressLine2], a.[City], sp.[Name] AS [StateProvinceName], a.[PostalCode], cr.[Name] AS [CountryRegionName], p.[AdditionalContactInfo] FROM [HumanResources].[Employee] AS e INNER JOIN [Person].[Person] AS p ON p.[BusinessEntityID] = e.[BusinessEntityID] INNER JOIN [Person].[BusinessEntityAddress] AS bea ON bea.[BusinessEntityID] = e.[BusinessEntityID] INNER JOIN [Person].[Address] AS a ON a.[AddressID] = bea.[AddressID] INNER JOIN [Person].[StateProvince] AS sp ON sp.[StateProvinceID] = a.[StateProvinceID] INNER JOIN [Person].[CountryRegion] AS cr ON cr.[CountryRegionCode] = sp.[CountryRegionCode] LEFT OUTER JOIN [Person].[PersonPhone] AS pp ON pp.BusinessEntityID = p.[BusinessEntityID] LEFT OUTER JOIN [Person].[PhoneNumberType] AS pnt ON pp.[PhoneNumberTypeID] = pnt.[PhoneNumberTypeID] LEFT OUTER JOIN [Person].[EmailAddress] AS ea ON p.[BusinessEntityID] = ea.[BusinessEntityID] GO |
Here’s the general shape of our plan. Just note that the bars connecting operators are narrow– SQL Server has pretty low (and accurate) estimates of how much data will be flowing through these pipes:

Now, this query is already a little troubled. It has a lot of joins, including outer joins. It shows an optimization timeout in the plan. The plan estimated cost is 1.1 and it estimates it’ll bring back 229 rows. In my test environment it takes 16 ms to run and does several thousand logical reads across the many tables it joins. This means the query optimizer didn’t consider every possible plan, but hey, our runtime was pretty darn good anyway.

Now let’s cause some real trouble. We’re going to make only one type change to this query– we’re going to add functions to the joins. These functions mimic what a user might do if they were concerned about leading/trailing characters. This is going to do several things:
- Force SQL Server to do an implicit conversion to the columns in order to apply the functions
- Effectively apply the functions row-by-row to do the comparison at runtime
- Together this makes it incredibly hard for it to properly estimate the number of rows that come out of the joins.
Here’s our revised query:
|
1 2 3 4 5 6 7 8 9 10 11 12 13 14 15 16 17 18 19 20 21 22 23 24 25 26 27 28 29 30 31 32 33 34 35 36 37 |
SET STATISTICS IO, TIME ON; GO SELECT e.[BusinessEntityID], p.[Title], p.[FirstName], p.[MiddleName], p.[LastName], p.[Suffix], e.[JobTitle], pp.[PhoneNumber], pnt.[Name] AS [PhoneNumberType], ea.[EmailAddress], p.[EmailPromotion], a.[AddressLine1], a.[AddressLine2], a.[City], sp.[Name] AS [StateProvinceName], a.[PostalCode], cr.[Name] AS [CountryRegionName], p.[AdditionalContactInfo] FROM [HumanResources].[Employee] AS e INNER JOIN [Person].[Person] AS p ON RTRIM(LTRIM(p.[BusinessEntityID])) = RTRIM(LTRIM(e.[BusinessEntityID])) INNER JOIN [Person].[BusinessEntityAddress] AS bea ON RTRIM(LTRIM(bea.[BusinessEntityID])) = RTRIM(LTRIM(e.[BusinessEntityID])) INNER JOIN [Person].[Address] AS a ON RTRIM(LTRIM(a.[AddressID])) = RTRIM(LTRIM(bea.[AddressID])) INNER JOIN [Person].[StateProvince] AS sp ON RTRIM(LTRIM(sp.[StateProvinceID])) = RTRIM(LTRIM(a.[StateProvinceID])) INNER JOIN [Person].[CountryRegion] AS cr ON RTRIM(LTRIM(cr.[CountryRegionCode])) = RTRIM(LTRIM(sp.[CountryRegionCode])) LEFT OUTER JOIN [Person].[PersonPhone] AS pp ON RTRIM(LTRIM(pp.BusinessEntityID)) = RTRIM(LTRIM(p.[BusinessEntityID])) LEFT OUTER JOIN [Person].[PhoneNumberType] AS pnt ON RTRIM(LTRIM(pp.[PhoneNumberTypeID])) = RTRIM(LTRIM(pnt.[PhoneNumberTypeID])) LEFT OUTER JOIN [Person].[EmailAddress] AS ea ON RTRIM(LTRIM(p.[BusinessEntityID])) = RTRIM(LTRIM(ea.[BusinessEntityID])) |
There have been a LOT of changes to the shape of this plan, as well as to the size of those pipes!
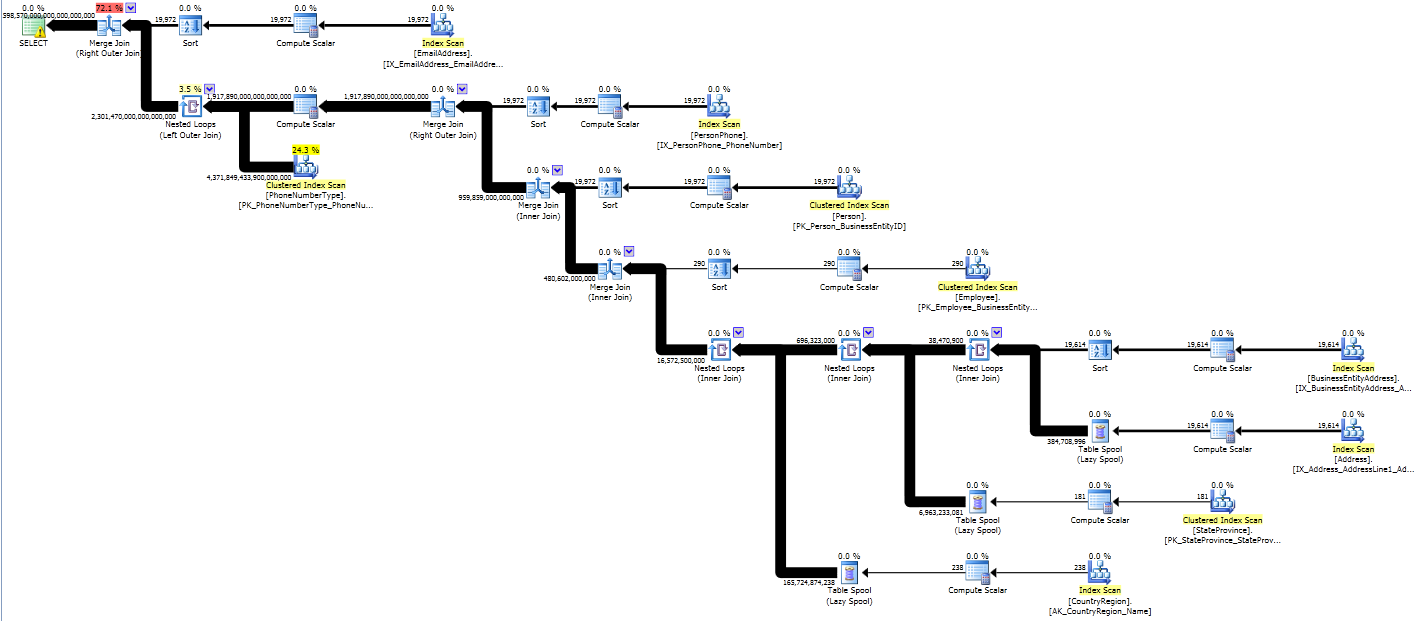
Instead of being able to use column or index statistics to properly estimate how many rows that come out of the joins, instead we end up with estimates that are sized as if every row might join with every row (a Cartesian product). That requires some heavy lifting!
Our second plan has an estimated cost of 645 trillion. SQL Server thinks it might return 4,598,570,000,000,000,000,000 rows (however many that is– I’m not sure how you even say that). The return data set is estimated as a HUGE amount of megabytes.
In my test environment it takes 122,046 ms to run (as compared to 16 ms) and does more than 4.8 million logical reads (as compared to several thousand). It chews up lots of CPU on three of my four virtual CPUs for the whole time it runs, even though it’s not parallel. Of course, it returns the same 290 rows of data at the end as the original query. (It just takes a LOT more work to do it!)
We can learn a lot from examining why this query has to use 7,600 times more CPU. And we can use this query to reproduce some pernicious problems that sometimes attack production environments.
Big queries need big memory reservations
Let’s compare some information from our two queries. We’re using SQL Server 2012 so we get some very rich information in our execution plans regarding our “Query Workspace Memory Grant”. This type of memory is used for query execution specifically. When SQL Server starts running a query it needs to figure out a minimum amount of memory that’s appropriate for all the sorts, spools, joins, and other things it may need to do in memory in the query. The more work it needs to do, the more of a query workspace memory it may need to ask for.
This memory is totally separate from the memory SQL Server uses to cache data in memory (the “buffer pool”) and the memory SQL Server uses to cache execution plans. In fact, this memory is “stolen” from the memory used for caching data pages. (Hey, it’s gotta come from somewhere, right?)
Our revised query (overly high estimates due to the functions in joins) is on the left. Our original query is on the right.
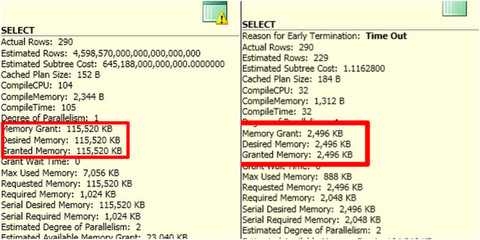
That’s a big difference, right?
If you run a lot of big queries like this at the same time, those bigger query workspace memory grants mean that you may run low on the available amount of workspace memory for those types of queries. When this happens, new queries that come in may have to wait for a query workspace memory grant to run. This shows up as a RESOURCE_SEMAPHORE wait, which is shown here with Adam Machanic‘s nifty sp_whoisactive stored procedure.
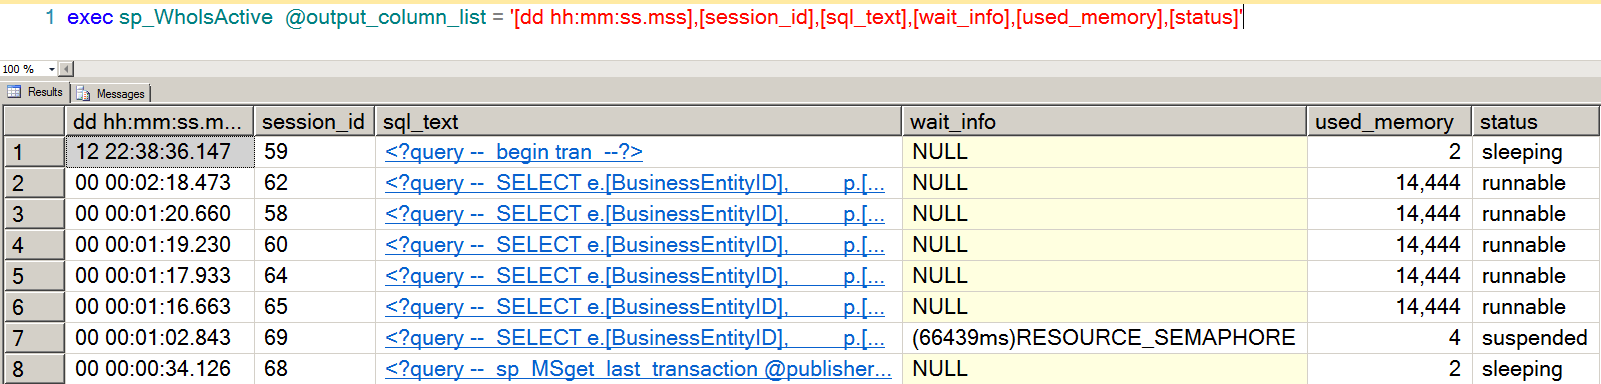
When this waits start happening, queries experiencing it literally can’t get out of the gate. They need a size of memory grant that just isn’t available, and they’ve got to wait around until their minimum grant can be met. (That’s fair, right? What wants to start running if there’s not enough memory to manage the query operators they need?)
Aside: Curious if you’re experiencing this problem in production? Our sp_blitz® procedure helps detect if you’re experiencing this type of wait.
Big queries may tear up tempdb
Another thing we can see with this experiment is that some large-sized operators may be super-expensive, even on small row sets.
Exactly what made our runtime so bad? Sure we thought a ton of rows were possibly going to come out of those joins, but in actuality they didn’t. It turns out that the second query actually really DID have to do a lot more IO than the first query. Here’s our STATISTICS IO output:
(290 row(s) affected)

Table 'Worktable'. Scan count 583, logical reads 4864543, physical reads 0, read-ahead reads 0, lob logical reads 0, lob physical reads 0, lob read-ahead reads 0.

Table 'PhoneNumberType'. Scan count 1, logical reads 581, physical reads 0, read-ahead reads 0, lob logical reads 0, lob physical reads 0, lob read-ahead reads 0.

Table 'CountryRegion'. Scan count 1, logical reads 4, physical reads 0, read-ahead reads 0, lob logical reads 0, lob physical reads 0, lob read-ahead reads 0.

Table 'StateProvince'. Scan count 1, logical reads 4, physical reads 0, read-ahead reads 0, lob logical reads 0, lob physical reads 0, lob read-ahead reads 0.

Table 'Address'. Scan count 1, logical reads 216, physical reads 0, read-ahead reads 0, lob logical reads 0, lob physical reads 0, lob read-ahead reads 0.

Table 'BusinessEntityAddress'. Scan count 1, logical reads 46, physical reads 0, read-ahead reads 0, lob logical reads 0, lob physical reads 0, lob read-ahead reads 0.

Table 'Employee'. Scan count 1, logical reads 9, physical reads 0, read-ahead reads 0, lob logical reads 0, lob physical reads 0, lob read-ahead reads 0.

Table 'Person'. Scan count 1, logical reads 3820, physical reads 0, read-ahead reads 0, lob logical reads 0, lob physical reads 0, lob read-ahead reads 0.

Table 'PersonPhone'. Scan count 1, logical reads 122, physical reads 0, read-ahead reads 0, lob logical reads 0, lob physical reads 0, lob read-ahead reads 0.

Table 'EmailAddress'. Scan count 1, logical reads 186, physical reads 0, read-ahead reads 0, lob logical reads 0, lob physical reads 0, lob read-ahead reads 0.
Look at that first line. Why the heck did we have to do almost 5 million reads against ‘Worktable’? And what exactly is worktable?
Let’s go back into that plan again. Look at the spool operators– they are where all those big pipes start. First we’ll hover over the line coming out of the spool.
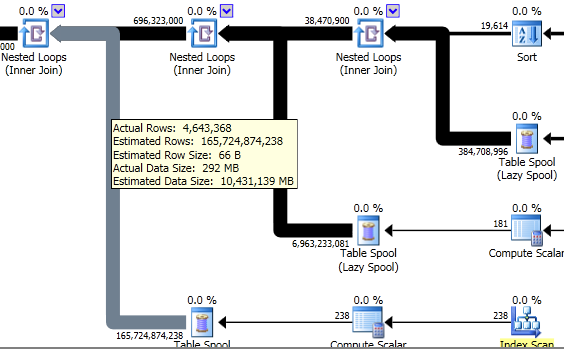
These “spools” are worktables being built in memory (and tempdb) in SQL Server. Not only are there a high estimated number of rows coming out of these, but there’s a high actual amount of rows coming out of them as well.
If we look at the spool operator itself, we can see that each spool had to be accessed over and over again at runtime in our system to feed data back up into the nested loop join:
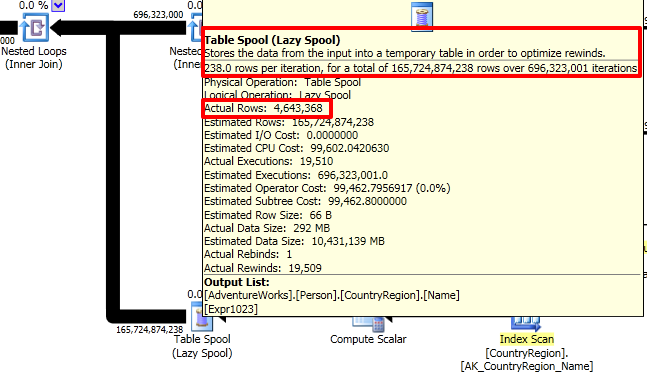
Because SQL Server had to do a lot of heavy row-by-row comparisons and wasn’t sure exactly how many might feed out of each of them, it decided to build “spool” temporary tables behind the scenes. It loaded the the temp tables up in memory turn by turn and then had to go through a long, painful process of reading from them. It did this three times, in sequence.
You don’t have to have big data to have big query problems
The SQL Server optimizer is really clever, but often in production it gets into a bad situation. This can be caused by complex query patterns, poor data statistics, or TSQL anti-patterns.
This can be really tricky to identify, diagnose and fix in production if you’ve never seen it before. If you’re used to working with small databases, don’t worry– you can use techniques like I’ve outlined here to help you easily recreate in a small test environment what production might look like with big “beefy” queries running all at once.
Learn More in Our Execution Plan Training
Our How to Read Execution Plans Training explains how to get an execution plan, how to read the operators, and learn solutions to common query problems.

61 Comments. Leave new
Very good info, Kendra! I’m walking through it a 2nd time.
FWIW, according to WolframAlpha.com, that humongous number is about 4 sextillion *snicker*.
Thank heavens, the internet can help me count! 🙂
I have this issue now, it is not the end of the World but for such a simple query I have, and since I have all else fine indexes, Statistics etc, I wanted to see the simple Query Plan with a good Actual = Estimated Match and was surprised to see the Estimated is actually twice as big as the Actual is e=2*a funny thing. My query Plays with around 30 million rows and it is taking about 10 minutes.. all it does is a simple group and a sum(). It runs in a Virtual environment, I am not an expert but I have never see one of these VM perform even close to real environment that said, can workload overestimation influence performance? I am more of a programmer if you know what I mean but need to also work as a DBA which is fine just need to get more experience.. Also this data will grow very rapidly, every month so I want to get it right now when is just a few millions.
Angel – yes, absolutely, as we discuss in the post.
Thank you, well the query is about the simplest there can be it just manipulates HUGE data so. It can be broke into pieces, I mean it could but it is like crazy to take a query like
select
c1,
c2,
…
sum(cn)
from t1
group by
c1,
c2,
…
and split it into many smaller sets queries to later have to sum() all any way don’t you think. or use union with smaller sets I remember doing something similar and at the end the super smarty SQL query processor ended up with exactly the same query plan, like saying hahah you smart Angel hahaha I am smart and I cant tell is the same query as before…….
Thank you very much
Note actually the query spends 85% doing Hash Aggregation….which do be honest on a 30 million rows I don’t think a loop or merge or any other method can win over a Hash but …I mean HASH is a one time thing if it hits it aggregates if it does not adds a new HASH value etc…
Have a look at this:
https://www.brentozar.com/archive/2015/06/indexing-for-group-by/
Thank you very much
I see yes I thought that one, don’t ask me why but this query has over 20 columns in the group by.. See this is the deal some people I work with like using Excel Pivot for Huge Datasets they don’t like looking at reports they like to play with the Data so, I give them what they ask, summarized to a certain level a bit above grain level. So.. Is very simple query it just pulls HUGE sets, I don’t understand to be honest how can SQL which is a very good product I love it been using it since practically when it was Sybase but how can it miss estimate such a simple query and I have RAM plenty over 80 GIGs so..It returns from 30+ mill about 24 mill and it estimates 60 million.. all else is fine it uses indexes fine less than 1% in seek etc.. and at the HAS aggregate it spends 85%… I thought it was IO so I monitored it but not really it does reads by intervals like read 100,000 then a lapse then anbother 100,000 you can see the peaks..so
thanks. very much
Angel – 80GB isn’t that much memory anymore. (We see a lot of servers with 256GB-1TB of RAM for, as you say, “HUGE” sets.)
Thank, I will show the IT guys who doo all that and hope the understand, when I asked for more memory it gad 64GB they were shocked and looked at me as if I was a strange creature, but in a way I understand they have always dealt with Transaction based Servers and Normal Databases, never with a Database used for Analysis and with Historical Data, so. All I need to find is a good article where this is explicitly pointed out and then I will get a bigger Server. Also All this I call Servers are actually VM and to my surprise VM have more limitations than actual servers. I mean the IT told me for example that you cant go beyond this 80GB and that Disk VM disks are limited to 2 Ter, this last one I think is ok because I can split the Database into many disks like some tables here and other there but the RAM..They use a storage system I think is called NEtApps. Do you people know a good article that talks about HUGE data and VMs?
I told the IT that by now Servers which are used to analysis lots of Data should have at least 1 TER they laughed and said Are you crazy hahah no one has that. Which I know it cant be true. It would be nice an article which speaks about deploying HUGE Databases in VMs, you know VMware stuff. I impersonally don’t like VM but for IT is very good they create machines with two clicks.
Thanks
I found this article by you
https://www.brentozar.com/archive/2011/05/keys-deploying-sql-server-on-vmware/
It would be nice an article with numbers benchmarks etc…of HUGE data on VM…then they see……..
I think I need a dedicated Server all for me…
A Miracle of Statistics?
The query is estimating correct or at least a lot better this morning
from estimating 60 millions of 30+ million now is down to 29 millions estimated. Well I can only think of Statistics cause I have not changed anything else. Well now it switched from 1% Index seek to 28% non cluster seek and the HASH aggregation is down to 60% which was 80%. The query time remains pretty much the same so..
Thank you
I normally run into the issue where SQL Server underestimates the number of rows when joining tables with a foreign key defined as referenced in https://connect.microsoft.com/SQLServer/feedback/details/772232/make-optimizer-estimations-more-accurate-by-using-metadata
and turns even worse when using multiple columns in the join similiar to https://connect.microsoft.com/SQLServer/feedback/details/243805/query-optimizer-choosing-improper-join-resulting-in-longer-execution-time
I hadn’t heard of SQL Server overestimating rows returning so it was interesting to learn about this situation. Thanks Kendra.
It’s weird, isn’t it? I’ve run into it a couple of times where it’s all “ZOMG, that’s going to be a ton of work!” and it actually creates bizarre problems.
Those row counts might exhaust SQL Servers internal numeric precision 😉 Maybe we can induce negative rowcounts or “NaN rows”.
Great post! I had this exact problem once – those HUGE cumulative row estimates and bunches of merge scan joins when I knew there would be only a few rows actually returned. I wasn’t armed with any of the understanding as to why that you have provided here so this is great. I ended up breaking the query into 2 and using the first query find the needle rows in the hay stack and put them in a temp table. Then I joined that temp table to the world in the second query. Since the optimizer assumed 1 row for the temp table, it went back to low row estimates and indexed loop joins. That trick worked, but perhaps now better understanding the causes of inflated estimates I could fix the issue without breaking up the query.
I think we’re running into this. Tables with hundreds of millions of rows, dynamic ORM-generated sql with many joins, application users allowed to run LIKE queries, sometimes even double wildcard LIKE queries, etc. While we are getting better at identifying execution plans that are “bad” or inappropriate and using dbcc freeProcCache (planhandle) to remove them in response to performance complaints, I’m currently looking at our update stats jobs which run every night, sampling 80%. These use an algorithm to focus on stats needing the work most ( rows in table and changed rows ).
Recent reading is showing that unless you go below 50% sample rate (guaranteed disaster in our data base ), its faster to use fullscan ( and less thrashing of tempdb ). Update stat runs multi-threaded in fullscan. So now I just have to convince management to let me make some changes.
Hey Randy,
I think you’re focussing too much on the statistics as your sure fire solution. Updating stats with fullscan may be mildly faster than updating with 80%– but I’m not a fan of doing either of them. It does a ton of IO, it’s time consuming and extends maintenance windows, and in the long term it’s just not going to scale well.
Instead I’d step back and look at the problem more broadly. It sounds like the problem has to do with query plan stability. Statistics are only one of many ways that you can address plan quality– and since the 80% isn’t working for you, I don’t think the 100% is going to be any better.
I’ve seen lots of cases where focusing on statistics too much has distracted people from seeing different underlying causes AND kept them from seeing other possible solutions to get better performance. Be careful not to fall into the trap!
Kendra
Thanks Kendra. You’re absolutely correct. And I am sending the developers execution plans etc on a regular basis. Their problem is getting approval to work on performance-related items. In this new world of developer-driven database code, there is precious little the DBA can do but nibble at the edges and lobby to “throw more hardware at it.”
However, if fullscan does run faster ( as my testing is showing ) then the only argue I can see against adopting that is to go down below 50% sample — could take a very long time to get approval for that and the developers are 100% against any such notion. ( based on experiences back with stats updated at the very low “default” sample rate )
I respectfully disagree on the position of the DBA — as a consultant I help DBAs and developers alike figure out performance tuning solutions and learn new things. It’s clear from your first comment that updating statistics with a high sample rate hasn’t solved your problem. Perhaps updating statistics with fullscan will perform slightly better and help you keep an un-solution in place: but that doesn’t solve your real problem.
Well let’s just say that in many shops the DBAs role has “evolved.” But I agree that scanning millions and millions of records with update stats is not the real solution. Until the solutions can be put in place ( query redesign, database redesign to include partitioning and archiving of old records, etc ) we do see those 15-second IO messages in the sql log on a regular basis, most often during update stats and generally on tempdb data files.
Rather than a wholesale ( interim ) switch to fullscan, I was actually thinking of doing fullscan on some targeted stats that are involved in those really poorly performing “LIKE” queries.
If updating some stats fullscan does mean we get through more of them during our maintenance windows, so much the better.
As far as reducing the sample rate down below 30%, I really have no idea how to even start with that since our QA environments do not yet allow us to run a production-like load.
I agree with Kendra on a couple things here. The DBA role you’re in is what you make of it, not what they tell you it is. It takes work to build up enough respect with the developers to get you to that point, but when they see you are a service provider for them in dev as well as a guardian of prod then you can start changing your job.
With your problems, if the query plans are that flakey where they can go either way it’s been my experience that they just need a more obvious direction to go. Combining multiple similar indexes into one or even just creating a new covering index can do amazing things for your plans. You’re reading less, in the order you want it in, and your queries are comparing smaller subsets of data. That won’t eliminate slow disk response, but it will lessen the need to go to disk if it’s done right.
The “LIKE” queries, especially if they start with a wildcard are still an issue, but fixing that isn’t the only part of the solution. To me it sounds like you may be fixated on it has to be fixed one way, but there are incremental steps that can help while you work your way towards a bigger issue.
Hey
Thanx for the article ,
I am completely agree with h you but what is your take on that when a query is having good cardinality estimation is producing same query plan with way off cardinality estimation.
Hi Neraj. I’m not sure what you mean – can you elaborate on the question?
Consulting Lines!
Great!! It’s exactly what I was looking for…
Good points Steve. I think the level of analysis you’re talking about is probably beyond me. Time to bring in some of those high-paid senior DBAs at our headquarters in New York.
Randy,
It’s not beyond you, it’s just beyond what you can do without looking into it further. If you can reproduce this in NonProd environments then you can do SET STATISTICS IO ON before you run it and find out what table is killing you if you don’t know already. Read Grant Fritchey’s book SQL Server Execution Plans to know what the query’s doing and why.
Once you do that, compare the good and bad execution plans, reading from the top-right and going down the right side first. It takes some getting used to, but it’s a right-to-left path with new information popping in from below.
Find out where it’s different and find a way to make the good path even more obvious. Index changes are an easier spot to start than coding changes in many cases, especially if it’s vendor code, so start with that. Is it doing key lookups or scans? Can they be avoided or whittled down at all? Even if you can’t eliminate a key lookup with one more field, can you drop it from 10,000 key lookups to 1,000 by adding one more field that filters out more rows?
Those “high-paid senior DBAs” you speak of, they were data analysts a couple years ago who started reading and experimenting a lot. Keep in mind, it’s not beyond you, it’s just a learning opportunity.
I downloaded Grant’s book. Thanks ( there goes the weekend 🙂 )
Well Said Steve !!!
———————————————
Hi Kendra
Thanks a lot for sharing this .. its very helpful … and the below line holds more and more true ..
“”YOU DON’T HAVE TO HAVE BIG DATA TO HAVE BIG QUERY PROBLEMS””
For those who stop by in 2023, follow the link to download the book: https://www.red-gate.com/simple-talk/books/sql-server-execution-plans-third-edition-by-grant-fritchey/
Was reading one of Grant Fritchey’s articles and came upon this in the comments:
“When index maintenance is regularly occurring, I feel there’s a common link between bad design and the necessity to manually update statistics.
Unfortunately, many DBA’s are trained that high fragmentation is the only indication that there’s an issue. Typically, bad database design also goes hand in hand with bad sql as well. I’ve seen designs that my 6 year old could better. All the index maintenance in the world wouldn’t keep that ship afloat as those table scans, hash joins, and sorts need very fresh stats and ad-hoc plans.”
https://www.simple-talk.com/sql/performance/sql-server-statistics-questions-we-were-too-shy-to-ask/
The only good news for me is the development team designed the database. We brought in a team of senior DBAs from our headquarters to review everything, and ultimately it was decided that development would also drive the “re-design” along with archiving and partitioning. I wasn’t involved but can only guess that the ORM approach along with business rules buried in .net code was foreign enough that the DBA team threw in the towel.
Hey Randy,
Let’s not go through your environment in the comments. The root cause of your perf issues just isn’t something that there’s room to identify here. There’s two general things that I hope we both agree are true:
1) ORMs are not necessarily evil. They can be tuned, they can perform well.
2) Updating statistics is not the ONLY way to solve performance problems with an ORM. There are many more things that can be done to tune auto-generated code.
In my experience an ORM is often an excuse / scapegoat, and statistics are often a red herring. Just like being obsessive about index maintenance was 5 years ago, being obsessive about these two things will *also* often lead you in the wrong direction.
kl
agreed
hey Kendra.
Good Info.
Kendra. when do you think is a good excuse to kill a spid session.
I just killed a spid that was taking a lot of space on the tempDB. The temp db is on the C drive.
I know i should move the temp db from there but i only have a month here, getting familiar with the place.
Just want to know your opinion on it.
Let someone take all the space or letting the rest work as well.?? or should i start taking a different approach.
thanks.
Hi, Ramon. That’s not really related to this blog post. For questions, check out http://DBA.StackExchange.com. Thanks!
Hello Kendra,
Thank you for this article. I am not clear on one thing, memory assigned to sql is divided in 3 sections, one for sql data buffer,one of sql proc caching and one for linked servers,connection etc… The memory grant which is shown in the exec plan, i thought that is amount of memory that query would “reserve” under sql buffer cache, isn’t that the case?
Hi there–
Think about it this way: the buffer pool is data cached in memory that many queries can use.
Query #1 starts up and it’s doing a join between two tables. The optimizer decides that it’s joining enough data that it wants to use a “hash join” where it builds two temporary objects, fills them up, and uses them to do the comparison and the join.
Those temporary objects for the hash join take up space in memory– and they need a separate copy of the data involved.
That’s the gist of query workspace memory. When a query executes it needs a different kind of memory to manage sorts, some joins, and even to manage parallel operations (if it has them).
Hope this helps!
thanks, so where is the “reserved memory” shown in the memory plan stored in? Which section of memory is it reserving?
The details are more complicated than I can handle in a blog comment, but the good news is that Adam Machanic has a great presentation with tons of info on this, and it’s available online. Follow this link to learn TONS on this topic:
http://sqlbits.com/Sessions/Event10/Query_Tuning_Mastery_Workspace_Memory_Internals
Hi Kendra, I feel I’m skirting on asking for a soluition and while that would solve my immediate issue doesn’t actually teach me why, so I’ll keep to the basics. Reviewing and applying where necessary of those comments above in the post and reviewing my many, many query plans I still come up shaking my head. I have wierd situation where an upper level view for a report has the following where clause
Table__8.”theDate_k” between ‘20131231’ and GETDATE() – effectivly just the current year to date info, and this returns approx 1000 rows but takes 7 minutes or there abouts, while the same query with this where clause: Table__8.”theDate_k” between ‘20130101’ and GETDATE() – returns about 6000 rows, yet only takes 50 seconds or so. the ony difference is the date, and yes the date data is the proper data type, Yet, the query plans are vastly different. I have done the following remedial actions but to no avail.
1. Endured the Index stats are up to date and fragmentation is managed at a acceptable level.
2. Reviewed and modified existing indexes to provide optimal covage. ( I have managed to eliminate a number of large index scans and Hash Match operationsa and that has replaced them with more appropriate operations.
3. Used sp_whoisactive to review active Plans and SQL texts. Although large, are not the largest.
4. Inspected Wait types and duration, possible blocks.
and in absolute dispair
5. DBCC freeproccache(of the badly performing plan).
(BTW in the process read Grants book – twice)
Given all these steps I’m at a loss to why the query selecting more data operates faster and uses a different Query Plan than that with a smaller date selection criteria ?
Have I missed something really basic ?
Any advice would be of benefit.
Cheers
Mal D
Hi Mal,
You’ve picked up a lot of information and you’re just putting the final pieces together– good work!
So, you’ve established that the longer date range is getting a different query plan than the shorter date range. It sounds like this is consistent when forcing recompilation, and that the longer date range’s query plan is more efficient.
To figure out why the query plan for the shorter date range is less efficient, you’re going to need to dig into the query plans to solve the mystery. There’s two ways you could approach this:
1) use SQL Sentry’s free plan explorer tool to “anonymize” the plans and then post them to SQLPerformance.com (owned by SQL Sentry) and ask for help. That does require sharing the plans so make sure everything in them is properly anonymized and that it’s OK to do it.
2) You could watch “Watch Brent Tune Queries” for techniques and information that will help give you insight into what to look for and what to do. This is a less direct route, but doesn’t require you sharing the execution plans if that’s an issue. (https://www.brentozar.com/archive/2014/01/watch-brent-tune-queries/)
Hope this helps!
Hi Kendra,
Thank you for your post, really enjoyed it. We are having an issue whereby the optimizer provides different query plans for the same stored proc using the same parameters when run in two similar machines (same sql server version, same database, same number of cores, one has double the memory the other one has). The main difference in the plans is not the nodes or operators, but the Estimated Number of Executions for a Key Lookup. Looking at the query plan in server A, the Number of Estimated Execution is 3153 while the same operator in the query plan for server B is 365. The number of logical reads a temp tables created by the proc is 495754482 on server A and 226 on server B. Server A and Server B participate in trans replication with Server A having the publisher database and B the subscriber database. I have compared the two databases and instances and cannot find a justification for this behavior. Any idea what could be causing this?
Sure. The two most likely culprits are either differences in statistics (estimates) or parameter sniffing. (Hardware differences can cause the optimizer to generate different plans, but from what you’ve said that seems less likely than the other two causes.)
More info:
https://www.brentozar.com/archive/2013/06/the-elephant-and-the-mouse-or-parameter-sniffing-in-sql-server/
https://www.brentozar.com/worlds-worst-performance-tuning-techniques/
Thanks for your reply. I’m still puzzled by this. Could differences in statistics (estimates) or parameter sniffing still explain the differences considering that we are talking about the same stored proc against the identical databases with exactly the same parameters?
I’m going to check out the links you suggested.
Thanks again,
Aldo
Yes. The statistics aren’t replicated– you’ll have different statistics on the publisher and on the subscriber tables. And parameter sniffing can happen on either server as well.
I understand and appreciate your help.
Thanks again,
Aldo
Oh, forgot to mention, the optimizer on server A (former worst performer) is producing optimal plans again with estimated numbers closer to actual numbers (just exactly as in server B). What could cause such change in behavior on the optimizer?
A change in statistics or a recompile (that bumped out a bad plan in place by parameter sniffing). Please use the links I provided to research more about the issue in those areas. Those are both complex topics and they can’t be explained well in these short comments, but those links go into much more depth.
Dear Kendra,
thanks for great article. Hope you can find some time to following case :
I’m issuing following query against AdventureWorks 2012 on my VM (500 MB) with max memory setting 300 MB
SELECT * FROM Production.TransactionHistory th
INNER JOIN Production.TransactionHistoryArchive tha ON th.Quantity = tha.Quantity
EstimateRows=”2283840000″
Estimated data size 251 GB
Hash Match (Inner Join) Cost : 100 %
I was quite surprised why it goes to page file instead of tempdb. As memory pressure (External virtual ) could be a symptom, but thought that hash match will spill in Tempdb as worktable ….
Actually I’m quite confused when we can talk about spills into tempdb (hash & sort warnings), spools operators only presented in execution plan and bad estimates with amount of rows accompanied with low memory grant ?
I would be very glad if you can put more light into problematic.
Thanks.
Jan
Forgot to mention that Tempdb was inactive and page file bloated out.
Oh, I see your question. Just because the page file grows doesn’t mean SQL Server is actively using it. If you haven’t limited the size, Windows will grow it out in the background “just in case”. You can check the SQL Server Error log to see if it was paged out to the log file, if that happens it will generally print panic messages in there.
That join on quantity should return a massive amount of rows, though, right? That doesn’t necessarily seem like the row estimate is unreasonable just from first glance.
All that being said, 300MB is a very small amount of memory to run big queries in, and management studio itself may fall over trying to pull back and present those results.
Hi Kendra,
Thanks for your brilliant post.
I’ve a similar situation where the sort operator is guessing ALL the rows of the index being used(filtered) if i use a date function on the predicate(not the column itself)
for example :
SELECT from table a — no joins but window function applied
WHERE
commentDateTime > dateadd(month,datediff(month,0,getdate()) – 13,0)
the sort operator estimates the total number of rows within the filtered index being used while If i change the dateadd for a fixed date (2014-01-01) it estimates correctly the number of rows being returned by the index.
How can I sort this out properly ?
Tiago – when you’ve got questions not exactly related to the blog post, your best bet is to head over to http://dba.stackexchange.com and post the question along with repro code over there.
Brent , I thought it was related as Kendra was talking about inflated sorts and how functions applied on the predicate columns could affect the query plan.
I’m sorry
No problem! I can see how you’d get mixed up there. This one’s about memory grants due to high row estimates, though.
Brilliant Article Brent !
I just used it in my environment to simulate the scenario for educating aspiring DBAs. Very intresting
Hi In my production environment , one query took last_grant_kb was 11GB, query was using the Merge statement and forseek index hint. How can i evaluate this.
Jitesh, for q&a head over to dba.stackexchange.com
Thanks!
I know this is an old post but after reading it I thought I would share a scenario that fits into this topic quite well. We see this behavior in our environment fairly often and the primary culprit turned out to be implicit conversions that were happening due to the JDBC driver connections insisting that all strings be passed as nvarchar(4000).
We don’t use unicode datatypes in our DBs so each time these run, it is riddling the plan with implicit converts that, in turn, cause table scans and crazy bloated numbers like 1.6T expected rows and 25 actually returned. We are trying to implement DEV adding sendStringParametersAsUnicode=false to the connection strings across our entire codebase to mitigate this problem. The above addition sends the parameters requested as varchar instead of nvarchar and it helps with the issue drastically.
For reference, one query was getting a 480GB memory grant each time the query was run and actually using ~1800KB