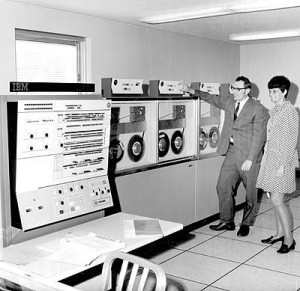
When my Grandpa Ozar wanted to find out if his 10 megabyte 5.25″ hard drive was responding fast enough to handle his database loads, he monitored the Perfmon counter Physical Disk: Disk Queue Length. This metric told him how many requests that the 486sx/33 processor had sent off to the hard drive that hadn’t come back yet. Average disk queue lengths greater than 2 meant that the hard drive wasn’t quite keeping up.

To fix performance problems, Grandpa upgraded to RAID arrays with multiple hard drives. When his end users complained that his array of 9 gigabyte SCSI drives weren’t returning their queries quickly, he still monitored that same Disk Queue Length metric. He interpreted the results differently, though, because he had multiple drives in each array. He multiplied the old 2-queue-length guideline times the number of drives he had in the array. A RAID 5 array with 8 drives might be underperforming if the queue lengths averaged 16 or more. At night, Grandpa followed Usenet debates about whether to include the parity drive, and how to handle differences between read and write queues on RAID 10.
Dad Started Using a Stopwatch
By the time Dad started getting involved in system administration, Storage Area Networks (SANs) had made things complicated. He couldn’t count the number of drives in a particular array because that number kept changing, and those drives were shared between multiple servers. In a SAN, a twenty-drive RAID 10 array might be shared between a couple of database servers and a file server with different load patterns, different peak load hours, and different capacities.
Instead of measuring queue lengths, Dad watched response times. He used Avg Disk Seconds per Read to find out how long the SAN took to return data back to the Pentiums, and he referred to Microsoft’s published guidelines for OLTP and OLAP expected response times for reads and writes. Just finding out if drives were “fast enough” meant finding out what kinds of databases were involved and what they were doing, which made things confusing for end users.
The New New Way: Wait Stats
While I’d like to think my family line has been carefully bred for systems administration abilities, the reality is that I’m the product of decades of hospitality industry work in close proximity to large quantities of alcohol. Mercifully, systems administration has changed over time to be less math-oriented and more logic-oriented.
To find out what to tune, ask a simple question: what’s the server waiting on?
I love me some Perfmon metrics, but more and more database administrators are turning to a different way of performance tuning: wait statistics. SQL Server tracks what it spends time waiting for, and analyzing those statistics are the most efficient way to find the bottleneck. Who cares if the storage takes 10 or 100 milliseconds to return data from a particular query – the more important question is, was SQL Server waiting during that time, or was it working on something else anyway?
This is especially important in the age of virtualization and consolidation. Corporate management is less concerned about achieving the best possible performance, and more concerned about Good Enough. We have to be very careful to spend money only on the components that will truly make an order-of-magnitude performance difference, and not throw away money on things that will only make an incremental improvement.
Wanna learn how to measure performance with wait stats? Here’s my recommended reading:
- Performance Tuning with Wait Statistics – Joe Sack’s presentation on how to use wait stats. Definitely the best place to start.
- SQL Server 2005 Waits and Queues – Microsoft whitepaper by Tom Davidson.
- Firefighting with Wait Stats – Jason Massie’s T-SQL query that keeps refreshing itself to show what the server’s waiting on right now.
- Jimmy May’s wait stats links – a collection of links for getting started with wait stats.
- Wait Events section at SQLServerPedia – with several articles and sample queries.
- Performance Management 2.0 webcast – explains wait stat analysis.
- Quest Foglight Performance Analysis demo webcast – Foglight PA uses wait stats to analyze performance instead of older queue-based metrics.
After wait stats, what’s the future of performance management? I have no idea – but I’m the end of the Ozar family line anyway.
(Note – I’m on vacation, so I probably won’t be responding to comments for a few days. I scheduled this post ahead of time. I’m on a sailboat in Lake Michigan, and I’ll respond if I get within wireless range. And yes, I’m bringing my laptop.)


14 Comments. Leave new
Nice article, @BrentO. Great way of selling the idea 🙂
Thanks!
Wish more of the articles had backward-compatible scripts for SQL 2000. Closest I’ve found is Tom’s original article at http://www.sqlmag.com/Article/ArticleID/40925/sql_server_40925.html (subscription required). Even without a subscription, you can download the scripts.
The reason you don’t see more 2000-compatible scripts is that SQL Server 2000 didn’t have Dynamic Management Views. These DMVs give you insight into what’s happening inside the database engine. Without those, the engine is much, much more difficult to tune. If you need performance tuning, you need to move to 2005 at the bare minimum.
Dude, Grandma had some nice gams. 🙂
Bozar,
All I said is well presented.
Thanks,
jason massie’s link is broken. any idea where is is now?
Jim – unfortunately, yes, Jason’s taken his site down permanently.
Brento….you are a champ …:)
Thanks Dad. 😉
you the best Brent..
Hahaha, thanks.
Posted in 2009… still being useful in 2015… thanks!
You’re welcome!