StackOverflow users often ask, “I’ve got this query that runs slow – can you help?” Here’s a few tips to get better, faster answers.
Get the query execution plan.

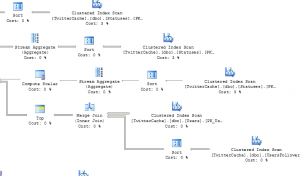
In SQL Server Management Studio, when you’re looking at the query editor window, click Query, Include Actual Execution Plan. It’ll show a fancy-pants flow chart diagram thingy that gets experienced DBAs all excited. Run the query, and you’ll get a new Execution Plan tab in the results.
Right click on the execution plan and click View XML. Copy/paste those contents, and then go to PasteThePlan.com. There, you can upload your query plan to share a link with the public.
This diagram does not include the results from the query (like your customers or sales data), but it does include information about your database schema (tables, indexes, views). If your schema is vitally secret, well, frankly, you need to hire a DBA, because you’re also probably not encrypting anything. But I digress.
In your StackOverflow question, include the link to this query plan.
Run sp_Blitz to generate info about your server.
sp_Blitz is like a health check for your server. Run it like this:
sp_Blitz @OutputType = ‘markdown’, @CheckServerInfo = 1
This generates a text-friendly health check that you can copy/paste into your Stack Overflow question to give people an idea of the kind of server hardware you’re dealing with.
What happens if…
If a query takes 5 minutes to run, then how long does it take to run if you immediately execute it again with exactly the same parameters? If it takes 5 minutes again, then we’ve got a different set of problems than if it takes a few seconds the second time.
If the query runs slowly from your application, then try running the exact same query from SQL Server Management Studio. If you’re running a query with dynamic SQL, like sp_executesql, try running it just by itself. Copy the string out, paste it into a new query window, and run it. Is it faster? Does the execution plan look different? If so, grab that and upload it as well.
If the query uses parameters, and it’s slow with some parameters but not others (like some customers run fast, but other customers run slow), then it might be a plan problem or a statistics problem. Run it with both sets of parameters (the fast and the slow) and include both sets of execution plans with your question.
Check your Windows event logs.
On the SQL Server, go into Control Panel, Administrative Tools, Event Viewer, and look at the System and Application logs. If you see any alerts that aren’t “Informational”, you might have a problem on the server. Examples include RAID array rebuilds due to a failed hard drive, memory failures, SAN controller errors, or an application that keeps crashing.
Sometimes, even Informational messages point to things that are making your query run slow. For example, I’ve seen instances where people complained about slow query speeds off and on through the day, and I found out that the antivirus software on the server was doing frequent definition updates. After each update, Symantec/Norton Antivirus does a scan of memory and a few files, which briefly brings performance to a crawl. This doesn’t show up as an error, but just as an informational message, but it’s a problem for you.
I wouldn’t post these on the internet, though, because they can include some detailed information about your server. If you’ve got questions about a specific event, it’s best to take a screen shot of that one event’s details and just post that.
Follow up with your question fast.
After you post the question on StackOverflow, set yourself a one hour timer with your phone, your computer, your microwave, whatever. After an hour, go back to the site, and answer any and all comments about your question that have popped up since. People will often need more information to solve your problem, and you want to catch ’em while you’ve still got their attention. Continue this for the rest of the first day (revisiting hourly) and then set yourself a to-do item in your task list to go back each morning and follow up again.
I’ve seen so many questions that get answered, but the original questioner never revisits the site to find out what the problem was. Even if you solve it on your own, at least go in there and make a note of that so that other people aren’t pulling up your question over and over to read through it.


3 Comments. Leave new
Hi Brent, this excellent post would be a great sofaq.
Very nice collection of thoughts Brent. Bookmarked!
Temp tables for me every time, especially for transactional systems. Narrow the cohort of records, run calcs, then add relevant labels (static data). I just got a Sproc from 1.3 billion logical reads to 49,700 LRs and performance from minutes to .004 of a second by killing off all CTEs. Nested CTEs with static data are wasteful