
Step 1. Run sp_Blitz and look for urgent warnings. sp_Blitz is one of the free scripts in our First Responder Kit. Just open the sp_Blitz.sql, run that to create the stored procedure, and type:
|
1 |
sp_Blitz |
It returns a prioritized list of things that are wrong, broken, or dangerous about your SQL Server. Focus on things in priority 1 through 50 – these are the big, urgent issues that can get you fired, or can cause showstopper problems:

If you’ve never run sp_Blitz before, the results can look overwhelming. That’s okay – just read through them one by one, copy/pasting the URL into your web browser for any alerts that you don’t understand.
This is like getting a totally free health check on your server. Often, we find huge performance issues in here, like misconfigured memory or parallelism settings. If you can, fix as much of the low-hanging fruit in here first – often, you can make a huge difference in performance just by working through this list.
Step 2. Run sp_BlitzFirst @SinceStartup = 1 to get your top wait type. This is another script in the First Responder Kit, and it’s focused on performance. Install it by running the contents of sp_BlitzFirst.sql, and then run it:
|
1 |
sp_BlitzFirst @SinceStartup = 1 |
The @SinceStartup parameter tells you what SQL Server’s wait stats have been since it started up:
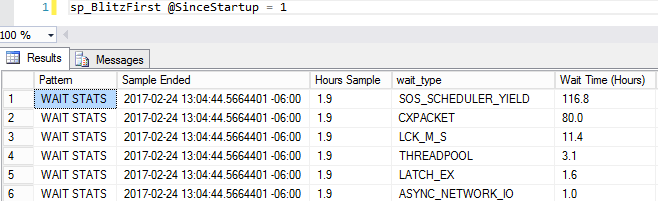
When SQL Server is working on stuff, it tracks what it’s been waiting on. The columns:
- WAIT STATS – the thing we’re measuring (if you go down further in the results, we show you more stuff in sp_BlitzFirst – ignore that for now)
- Sample Ended – when you ran sp_BlitzFirst
- Hours Sample – how long the server has been up
- Wait_Type – cryptic, more on this in a second
- Wait Time (Hours) – how long SQL Server has waited on this wait type
Here, in 1.9 hours, SQL Server has spent 116.8 hours waiting on something called SOS_SCHEDULER_YIELD. These wait types have a lot of oddball cryptic names, but here are some of the most common ones:
- SOS_SCHEDULER_YIELD – waiting on CPU cycles
- PAGEIOLATCH* – waiting to read data pages from a data file
- WRITELOG – waiting to write delete/update/inserts (DUIs) to the log file
- CXPACKET – parallelism, and this one’s complex enough that I wrote a post for it
Step 3. Run sp_BlitzCache to find the resource-intensive queries. The next script in our arsenal will examine SQL Server’s query stats. Run sp_BlitzCache.sql to install the proc, and then execute it:
|
1 |
sp_BlitzCache @SortOrder = 'cpu' |
In that example, I’m sorting by the most CPU-intensive queries, but you can also sort by reads, writes, duration, executions, and more.
Step 4. Ask for help. Now, you’re armed with great configuration data about your SQL Server, your top wait type bottleneck, and the queries causing that bottleneck. You’re much better equipped to post questions at DBA.StackExchange.com, SQLServerCentral’s forums, or SQLteam.com.
 And hey, we’re here for you too. We’re in the business of making slow SQL Servers go faster. We’re not free, though – make sure you give the above stuff a shot first, and if you can’t make the progress you want fast enough, that’s where we come in.

13 Comments. Leave new
“in 1.9 hours, SQL Server has spent 116.8 hours waiting”
Am I missing something here? Those figures seem a little… Off 🙂
Steve – brace yourself: SQL Server can run…MORE THAN ONE QUERY AT A TIME!
I know, stunning, right? I’ve just opened an amazing world of possibilities for you. 😉
No. I don’t believe it. I substitute your reality and replace it with my own!
Yeah, ok, it’s been a long day here, thanks for pointing out the blindingly obvious 😉
And keep up the great work, I always learn something new reading your blog posts!
Hahaha, you’re welcome, sir.
I probably missed something, but I can’t find sp_BlitzFirst listed in your replied email after I registered my email address (selected all 3 options) and clicked ‘Send me the goods’. Even I received your email reply, but I still can’t find any download link in that email, 3 links in it all point me back to the very similar pages that I find in your ‘Free Stuff’ area. And, this link is also dead: https://github.com/BrentOzarULTD/SQL-Server-First-Responder-Kit
HaHaHa, apparently the sysadmin blocked the access to github! He has downloaded the kit for me, so all is good now. But the email reply still doesn’t have any download link, this is no longer important:-)
There you go. 😉
Are you aware of any issue running this on SQL 2008R2 (10.50.4000)? I was running the latest version of sp_blitz across my Prod servers today to check for problems and when I got to one running 2008R2 the server crashed within a minute of me running it!
I have just tried the same on the dev, test and UAT versions of that server and UAT crashed as well.
Prod:
SQL Trace was stopped due to server shutdown. Trace ID = ‘1’. This is an informational message only; no user action is required.
SQL Server is terminating because of fatal exception c0000005. This error may be caused by an unhandled Win32 or C++ exception, or by an access violation encountered during exception handling. Check the SQL error log for any related stack dumps or messages. This exception forces SQL Server to shutdown. To recover from this error, restart the server (unless SQLAgent is configured to auto restart).
Error: 17311, Severity: 16, State: 1.
Problem creating symptom dump file due to internal exception
UAT managed to create a dump and had a slightly different error:
SqlDumpExceptionHandler: Process 21200 generated fatal exception c0000005 EXCEPTION_ACCESS_VIOLATION. SQL Server is terminating this process.
Richard – no, but that build (10.50.4000) is out of support – I’d probably start by patching my SQL Servers. If that fixes it, let us know at http://firstresponderkit.org. If there’s a bug in 10.50.4000, we can build in a short-circuit to avoid running on that build.
Thanks Brent. This looks like a likely candidate and was fixed in CU10 for SP2:
https://support.microsoft.com/en-us/help/2911026
Time for me to do some patching 🙂
Oh wow, good find! I’ve added an issue for that:
https://github.com/BrentOzarULTD/SQL-Server-First-Responder-Kit/issues/762
Oooh, seems I’ve been lucky to patch out SQL Server and solve issues / delete archaic memory dumps from my 2008R2. But that’d be either rare bug or triggered by some newer sp_Blitz build, because I did run it many times on 10.50.4000 with some old memory dumps still present on discs.