
The most popular way of using sp_BlitzCache® is to just run it – by default, it shows you the top 10 most CPU-intensive queries that have run on your server recently. Plus, it shows you warnings about each of the queries – if they’re missing indexes, experiencing parameter sniffing issues, running long, running frequently, doing implicit conversion, you name it.
But sometimes you just want to see the warnings for a query you’re working on – and the query isn’t in your top 10 most resource-intensive queries.
First, get the query hash. Run the query with the actual execution plan turned on, or just get the estimated plan in SSMS by hitting control-L. Right-click on any of the SELECT statements in the plan (or the one you’re most interested in) and click Properties.
Check out the QueryHash in the Properties pane:

Now you can run:
|
1 |
sp_BlitzCache @only_query_hashes = '0xC842136488344341'; |
And you get:
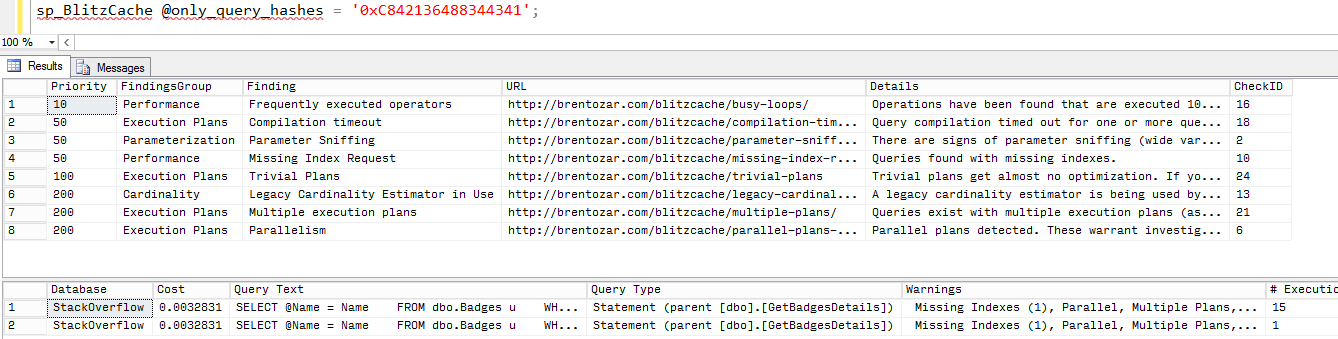
You get all of the executions of this query – which might be in different connection contexts, too, indicating you might be catching some parameter sniffing issues.
Want to see all of the other queries in that same stored procedure?
|
1 |
sp_BlitzCache @only_query_hashes = '0xC842136488344341', @results = 'expert'; |
Scroll across to the SQL Handle column, copy that data out, and paste it into sp_BlitzCache:
|
1 |
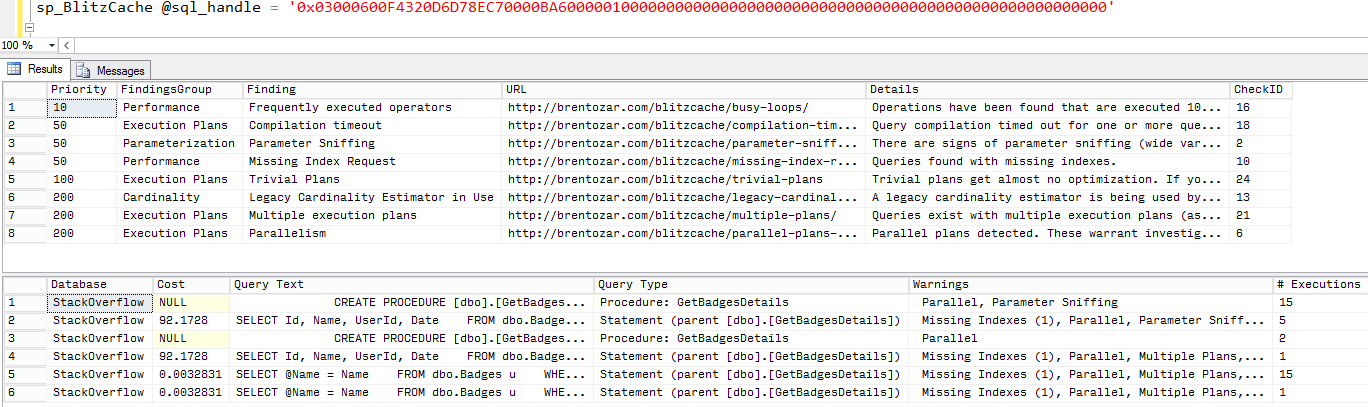
sp_BlitzCache @sql_handle = '0x03000600F4320D6D78EC70000BA6000001000000000000000000000000000000000000000000000000000000'; |
And you get a detailed analysis of that stored procedure and its queries:
If you’re on 2019, you can even see the last actual plan.
SQL Server 2019 introduced a new database-level option to store the most recent actual execution plan as queries run. This has to be enabled in the database ahead of time, though:
|
1 |
ALTER DATABASE SCOPED CONFIGURATION SET LAST_QUERY_PLAN_STATS = ON; |
Once you turn it on, your sp_BlitzCache execution plans will show the last actual plan – super useful if you’re trying to track down things like estimation errors and TempDB spills. There’s a performance impact to it, and there’s some debate about the exact overhead – I would just only turn this on when you’re going to be actively tuning a particular database, and then turn it back off once you’ve got the information you need.
Go download it, put it to work finding your ugliest queries, and discover what sneaky anti-patterns hide in the code. Yours, I mean, not ours. Ours has plenty too.

5 Comments. Leave new
Better to run:
sp_BlitzCache @OnlyQueryHashes = ‘(hash)’
to avoid the dreaded “@only_query_hashes is not a parameter for procedure sp_BlitzCache.” error. 😉
I am a video course subscriber and I’ve learned a ton from it!
One thing that is annoying however. It seems like the investigation and analysis sql provided often if not always – has a caveat in the comment to the effect of “don’t run in production”.
This significantly limits the usefulness of these tools for us since we don’t have an exact duplicate in terms of hardware, software, and load for TEST machines vs. PROD machines.
Hi, I keep having an error when I run sp_blitzcache with the sql handle parameter, it says the parameter is not valid.
Thank you!
Ed — this post is a couple years old now. Take a look at what valid parameters for it are. You can do it!
@OnlySqlHandles = ‘0x0200…’