If you’ve been following the blogosphere, or heading to SQL Saturdays, you’ll know that many folks are excited about the brand new SQL Server cardinality estimator (CE for short). As Kendra showed in her article The SQL 2014 Cardinality Estimator Eats Bad TSQL for Breakfast, the new CE provides dramatically improved query plans.
What if you want to know more about the new CE? What’s your option? Well, a lot of bloggers, presenters, and crazy people (I’m looking at you Paul White), will observe how the CE behaves by building carefully contrived scenarios and verifying the outcome. We can observe the CE in the same way that we observe the optimizer – by observing the side effects.
What if you want to know why something happened? To get an answer to that, you’d have to go directly to the source. Thankfully, the source has published their work in the paper Testing cardinality estimation models in SQL Server. Warning – this paper does cost money if you aren’t a member of the ACM.

Why would you want to go and read an academic paper like this one? Well, it contains a lot of juicy information about what the SQL Server product team considered in terms of possible optimization paths for the CE. One item of interest is the concept of a simple join optimization. To summarize – the simple join ignores histograms and assumes that all distinct values from the child are contained in the other table. This could cause some query estimation issues, but there will be faster optimization. The authors note that for some workloads, this will be much more desirable.
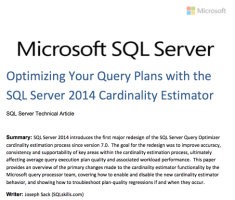
If you’re not up for an academic paper or two, Joe Sack has put together an in depth look in Optimizing Your Query Plans with the SQL Server 2014 Cardinality Estimator. It’s well researched, peer reviewed, and based on observable verifiable information that’s in the product right now.
What are you waiting for? Read a white paper or two today!


6 Comments. Leave new
Funny, I’ve been reading those two very papers this week. 15 US bucks isn’t too much to spend I don’t think.
I love love love the appendix which visualizes query consistency. Their example uses TPC-H query 9. It turns out to be easy to set up. The database can be constructed using HammerDB and the query itself is available on the web.
But Joe Sack’s whitepaper is simply the best thing I’ve read all year. It’s on my night table right now.
Anyone else who wants to go through the whitepaper step by step, but doesn’t have a handy SQL 2014 box handy can use technet’s virtual labs. http://technet.microsoft.com/en-US/virtuallabs
Any suggestions for an approach to test if Comp Mode 120 affect a set of queries badly. I was thinking about collecting query stats and comparing…
Comparing two execution runs gets tricky.
You can replay a profiler trace, but that doesn’t account for any pauses for application processing (e.g. read 500 rows, process them in the app, read 10000 rows). When you do this, the best thing to do is to compare your previous version of SQL Server to the desired version of SQL Server. Make sure you multiple traces/extended events sessions to capture errors as well as wait stats. You can use the collection and processing that I wrote up as a starting point.
If you’re feeling fancy, you can configure a tool like the SQL Server Distributed Replay functionality. I’ve never used the tooling, but the upside of it is that you can, in theory, configure it to replay application activity exactly as it arrived. This does require a new set of skills to learn for something that is probably going to be a one time event.
If you’re feeling really lazy, you can just draft up a known set of critical queries and compare how they run. You could even use this to draft up performance SLAs for your team to follow.
Ever see a query that fails to ever get an execution plan in compatibility mode 120 but succeeds like a charm with 110? We are experiencing it and have yet to derive a reason why.
I have never seen such a thing, but if you’re curious about it, I’d contact Microsoft and file a bug. It sounds like you’ve found a big issue.
Narrowed it down a bit further. The query at hand is using a udf that includes multiple sub-selects (ugly). The cardinality estimator (CE) appears to be fine against a database in 120 compatibility mode that has data. If the database is part of a “fresh install” where data is not present. In doing some digging, we found that someone else has encountered the same:
https://connect.microsoft.com/SQLServer/feedback/details/874532/query-hangs-with-new-cardinality-estimator-in-sql-2014-rtm
Thought it would be of interest where we narrowed it down.
DK