
It’s easy to find problem queries on your SQL Server after they’ve happened. You can open your favorite monitoring tool or look in the plan cache. Those options are great for finding things after they’ve happened, but what if you want to find problems as they happen?
Server Side Trace
You could set up a SQL Server Server Side Trace. This is an acceptable solution if you’re using SQL Server 2008 or earlier. There are a few problems with this approach.
Problem the first – the SQL Server Profiler UI is less than beautiful. The GUI interface is somewhat cumbersome and the scripting interface is hilariously bad. To make matters worse – to only capture a single query requires string based filtering. There’s a plan handle property available in profiler, but it’s not available for TSQL or stored procedures.
As much as I like string matching in T-SQL (hint: I don’t), I think it’s fair to say that Profiler/Server Side Trace are best avoided unless you’re using SQL Server 2008 or earlier.
Extended Events
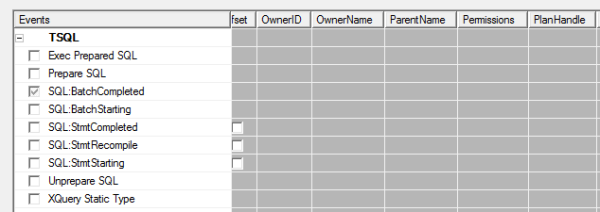
Extended events are nowhere near as hard as you’d think. Trust me on this. How do I know? I set up an Extended Events session to grab a particular query.
Here’s what you do:
- Create a crappy stored procedure. Use your imagination.
- Run the stored procedure a lot.
- Grab the
query_hashfor that stored procedure. The easiest way
I’ve found to do this is to use our plan cache query to identify it. Myquery_hashis0x2B42702322C10821. What’s yours? - Create an extended events session to capture that specific query hash.
Step 4 isn’t as easy as it sounds. Astute readers will note that I never said this was easy, just that it’s not as hard as you would think.
Even though the query_hash is stored as a hexadecimal in SQL Server, Extended Events would prefer to see an unsigned 64-bit integer. To get this magic number, take your query_hash and cast it as either a BIGINT or a DECIMAL(20,0):
|
1 2 |
SELECT CAST(0x2B42702322C10821 AS BIGINT); /* my magic number is 3117177188303046689. */ |
Once you convert the query_hash to a magic_number, create your Extended Events session. I chose to capture the sp_statement_completed and sql_statement_completed events and a number of server level events like time, app name, and client host name. Here’s what it would look like capturing this to a file:
|
1 2 3 4 5 6 7 8 9 10 11 12 13 14 15 16 17 18 19 20 |
CREATE EVENT SESSION [query hash] ON SERVER ADD EVENT sqlserver.sp_statement_completed( ACTION(package0.collect_system_time, sqlserver.client_app_name, sqlserver.client_hostname, sqlserver.database_name) WHERE ([sqlserver].[query_hash]=(3117177188303046689.))), ADD EVENT sqlserver.sql_statement_completed( ACTION(package0.collect_system_time, sqlserver.client_app_name, sqlserver.client_hostname, sqlserver.database_name) WHERE ([sqlserver].[query_hash]=(3117177188303046689.))) ADD TARGET package0.asynchronous_file_target (SET filename = 'C:\temp\XEventSessions\query_hash.xel', metadatafile = 'C:\temp\XEventSessions\query_hash.xem', max_file_size=5, max_rollover_files=5) WITH (MAX_DISPATCH_LATENCY = 5SECONDS); GO |
Once you have that up and running, you should be able to start the session, if it isn’t already started, by running:
|
1 2 |
ALTER EVENT SESSION [query hash] ON SERVER STATE = START ; |
Just like that, you’ll be capturing your terrible queries to disk where you can mine the extended events files for gold and glory at your own convenience. If you want to query it, it’d look something like this:
|
1 2 3 4 5 6 7 8 9 10 11 12 13 14 15 16 17 18 19 20 21 22 23 24 25 26 |
WITH events_cte AS ( SELECT DATEADD(mi, DATEDIFF(mi, GETUTCDATE(), CURRENT_TIMESTAMP), xevents.event_data.value('(event/@timestamp)[1]', 'datetime2')) AS [event time] , xevents.event_data.value('(event/action[@name="client_app_name"]/value)[1]', 'nvarchar(128)') AS [client app name], xevents.event_data.value('(event/action[@name="client_hostname"]/value)[1]', 'nvarchar(max)') AS [client host name], xevents.event_data.value('(event/action[@name="database_name"]/value)[1]', 'nvarchar(max)') AS [database name], xevents.event_data.value('(event/data[@name="duration"]/value)[1]', 'bigint') AS [duration (ms)], xevents.event_data.value('(event/data[@name="cpu_time"]/value)[1]', 'bigint') AS [cpu time (ms)], xevents.event_data.value('(event/data[@name="logical_reads"]/value)[1]', 'bigint') AS [logical reads], xevents.event_data.value('(event/data[@name="row_count"]/value)[1]', 'bigint') AS [row count] FROM sys.fn_xe_file_target_read_file ('C:\temp\XEventSessions\query_hash*.xel', 'C:\temp\XEventSessions\query_hash*.xem', null, null) CROSS APPLY (select CAST(event_data as XML) as event_data) as xevents ) SELECT * FROM events_cte ORDER BY [event time] DESC; |
Cleaning Up After Yourself
Once you’re done watching a specific query or queries, make sure you clean up after yourself. There’s no reason to add extra load to SQL Server when you aren’t watching. Make sure to stop and remove your Extended Events session:
|
1 2 3 4 5 6 7 |
/* Stop the Extended Events session */ ALTER EVENT SESSION [query hash] ON SERVER STATE = STOP; /* Remove the session from the server. This step is optional - I clear them out on my dev SQL Server because I'm constantly doing stupid things to my dev SQL Server. */ DROP EVENT SESSION [query hash] ON SERVER; |
Augment Your Techniques
This won’t replace any other techniques that you’re using to find poorly performing queries. However, you can use this technique to find problem queries as they’re happening.
Different monitoring techniques provide you with a different view of the data. Our plan cache query shows you a historical record of what’s been going on, but it can only show so much. If a query has been run 14,400 times over the last 24 hours, does that mean it’s been run 10 times a minute for that entire period or is there a period of activity where that query gets run 1,440 times a minute for 10 minutes straight?
This isn’t going to replace the need for other tools you have at your disposal. It’s just another way to get the job done.

33 Comments. Leave new
Maybe I’m misreading your post, but it doesn’t seem you have described a method of finding a problem query but rather getting information about a running query you already know is a problem. Despite your comment in the first paragraph, at least one monitoring tool, SQL Sentry does in fact show you long running queries while they are running, and you don’t have to know what it is, or it’s plan handle beforehand. You don’t have to run a long query to find it, save it to a file then manipulate it, etc. etc.
Despite consultants infatuation with them, IMHO Extended Events are still not a practical solution for the everyday DBA. I’m not convinced they are a better solution than a server side trace in most cases, except that they are lighter weight, which in some cases may be an important consideration. They are certainly not a better solution than a quality commercial monitoring tool. I have yet to see a usable, scalable monitoring solution using only Extended Events.
Great comment, Justin. Tell me – how would you go about tracking a single problem query using nothing but a SQL Server server side trace?
Hi Jeremiah – I don’t think I would track a single problem query using a server side trace, if for no other reason than the one you cited regarding string matching. I would use my monitoring tool.
I realize that as a consultant for hire you often don’t have that luxury, so EE makes sense for this particular scenario. I just believe there are better options (at least one) for most DBAs working in their own environment where they hopefully choose/control the tools at their disposal.
The entire 4, 5, 6 step process, including writing, querying, and cleaning up files on disk seems like something out of the 70s.
Justin – wow, that’s interesting. Can you describe your monitoring tool usage scenario? I’m curious to see how installing, configuring, and using a monitoring tool can be done in less than 4 steps, but I can’t wait to see it. I’m excited to hear how much better they’ve gotten recently, and you sound like just the person to explain it to us.
Brent – Wow this is getting completely out of hand. I never suggested, nor would I suggest one would install, set up, and configure any monitoring tool for a single query tuning session. BTW, your sarcasm is unbecoming.
Ah, sorry. When you were calling Extended Events’ 4-5-6 step process as “something out of the 70s” I didn’t realize you were being serious, not sarcastic. I thought that with a comment like that, you would welcome more sarcasm. Clearly I was mistaken, and you really did believe that a 6-step process belongs with AMC Pacers and bell bottoms. I had no idea, and I apologize deeply.
I think Brent and Jeremiah misunderstood Justin. He didn’t say that what Jeremiah was doing altogeter was too many steps, he was saying steps 4,5,&6 are just archaic in what they are doing.. (just paraphrasing not my opinion). He also didn’t say to use SQL Server server side trace to track a problem, he said SQL Sentry, which I will go Google when I finish my comment to see what they offer.
I do agree with Justin that using the extended events in this scenario, you have to already know the query_hash of the sproc you are monitoring. I guess If you use Activity Monitor or Ask_Brent sproc, you can figure out your top running queries and then use that to feed the query_hash for monitoring.
[edit: Jeremiah’s name is in fact “Jeremiah” not “Miah”]
To be honest, I recommend that you clean things up at the end because if I don’t say it, someone is going to leave a server side trace running, fill up their C: drive, and then SQL Server is going to crash and someone will say it’s my fault.
Likewise – why not use the ring buffer? Someone is going to change a script, set it to 20GB of ring buffer, and then get upset when 20GB of memory went away because they filled up the ring buffer.
Modern file systems and networked computer systems are both amazing pieces of technology that came out of the 1970s… along with the main memory database. We should probably stop using SQL Server because it’s based on 1970s technology, too… right?
What about just using ClearTrace and/or ReadTrace?
Ryan – with either option you need to use string matching to match the query text that you’re looking for. If you only want to collect metrics on a single query, it’s much lighter weight to only collect that information on a single query from the beginning than it is to collect all queries and filter it later.
It’s been unfortunate that Justin’s comments have been misunderstood and the subsequent wraths. Anyway, we should get out of it and look for Brent and Jeremiah’s brilliant articles and guidelines.
[edit: Jeremiah’s name is in fact “Jeremiah” not “Miah”]
Having taken time to re-read my comments I realize they were off point and Ill considered. I even broke my own rule about not criticizing others in public. Jeremiah’s post was well written and informative. My comments took the discussion in the wrong direction. I hope you’ll accept my apology.
I like the article, and it (almost) makes me want to like Extended Events. However, I have an issue with the title “Finding One Problem Query With Extended Events”. If the query_hash has to be embedded in the EVENT SESSION, how is this helping to find the problem query? Sure, it will capture all sorts of goodies about a known problem query, but that isn’t what the title says.
Because the article describes a method to find a single query that causes problems?
I have to agree with Andy (and Justin’s original point), a much better title would have been “Examining a problematic query with Extended Events.”
Thanks for your contribution to the world of SQL Server Extended Events.
I just caught up with this chain of comments.
Jeremiah’s title makes sense to me with the word “find”. One problem I’ve frequently had clients come up against is needing to “find” and document how often specific queries run that they know have problems.
Their goal is to show the impact that the query is making in a simple way and justify a software development investment to make it better.
This post is the foundation for doing some VERY cool things that I don’t know of a way to do without Extended Events – “find” the waits associated with the problem query. Not just the overall wait on the server, but the waits by query. That’s certainly what I’d call and advanced/Senior DBA skill, but I don’t think it’s a “consultant only” skill or anything like that. (In that case I would say, “Let’s find the waits for the query in production.”)
This is probably just a difference of language– but the word “find” does seem natural to me in the context of how I’ve seen software development work.
But then, I also learned to speak English in Texas. 🙂
–Kendra
Thanks Kendra, I appreciate that one of three B.O.U. responders chose NOT to make a snarky comment. I’d like to think that despite y’all having elite minds you could sometimes see things from the perspective of us normal people.
Hi,
Why not use the DMVs to quickly and easily find problematic* queries as they happen (i.e. as they’re running)?
The following query reports on queries that have been running for more than 20 seconds (this can be changed), ordered by duration….
SELECT DATEDIFF(s, r.start_time, GETDATE()) AS [Duration(s)]
, c.session_id
,SUBSTRING (st.text,
r.statement_start_offset/2,
(CASE WHEN r.statement_end_offset = -1
THEN LEN(CONVERT(NVARCHAR(MAX), st.text)) * 2
ELSE r.statement_end_offset END –
r.statement_start_offset)/2) AS [Individual Query]
, st.text AS [Parent Query]
–, s.host_name, s.login_name, s.status, s.login_time, s.program_name, *
FROM sys.dm_exec_connections c
INNER JOIN sys.dm_exec_sessions s ON c.session_id = s.session_id
INNER JOIN sys.dm_exec_requests r ON c.session_id = r.session_id
CROSS APPLY sys.dm_exec_sql_text(c.most_recent_sql_handle) AS st
WHERE DATEDIFF(s, r.start_time, GETDATE()) > 20 — Query running over 20 seconds
ORDER BY [Duration(s)] DESC
You can filter by part of the query name too (if you’re after a known query)…
Thanks
Ian
Author: DMVs In Action (www.amazon.com/SQL-Server-DMVs-Action-Management/dp/1935182730/)
* problem may relate to CPU time, elapsed time, excessive reads/writes etc you can filter on this too.
Howdy Ian,
The DMV queries are great as long as a) the query you want to see is running and b) someone is there to run the query. Sure, you could sample, but then you have to sift through results.
Once you know the query you want to track, the code samples in this blog post will let you track all executions of a single query and determine the waits and I/O associated with each query. It breaks the waits down and computes the average, standard deviation, and several percentials (75, 90, 95, and 99).
So in answer to your question – your query does something totally different.
Hi Jeremiah
I still think that this can be indirectly achieved using db_exec_query_stats and dm_exec_sql_text. Something like this:
SELECT TOP 10
total_worker_time/execution_count AS Avg_CPU_Time
,execution_count
,total_elapsed_time/execution_count as AVG_Run_Time
,(SELECT
SUBSTRING(text,statement_start_offset/2,(CASE
WHEN statement_end_offset = -1 THEN LEN(CONVERT(nvarchar(max), text)) * 2
ELSE statement_end_offset
END -statement_start_offset)/2
) FROM sys.dm_exec_sql_text(sql_handle)
) AS query_text
FROM sys.dm_exec_query_stats
–pick your criteria
ORDER BY Avg_CPU_Time DESC
–ORDER BY AVG_Run_Time DESC
–ORDER BY execution_count DESC
Hi all,
I need help. How am I to go about finding the one problem query in sql server 2005
Bad news – what this post describes cannot be accomplished with SQL Server 2005.
Thanks Jeremiah, I know am very very late in responding back but thank you 🙂
Just tried to run SELECT CAST(0x2B42702322C10821 AS DECIMAL(20,0)); in SQL 2012 and got an error:
Msg 8115, Level 16, State 6, Line 1
Arithmetic overflow error converting varbinary to data type numeric.
I’ve corrected the post, it works with
BIGINT.This is actually a bug in SQL Server. If you want to see this kind of junk fixed, you can up vote it at SQL Server Extended Events query_hash predicate does not accept negative values.
Note that
BIGINTwon’t actually work for some values and you’ll have to resort to the joys of bit shifting via T-SQL. I see by your comment that you’ve already found the excellent article Correlating XE query_hash and query_plan_hash to sys.dm_exec_query_stats in order to retrieve Execution plans for high Resource statements.TL;DR please up vote my connect item so people don’t have to suffer any more than XEvents requires.
Upvoted. If Microsoft want people to adopt Extended Events as the standard, then they really should “fix” this by providing a system function to do the conversion. In the mean time, I will have to resort to switching off the most significant bit.
I’ve found if you’re pulling quite a bit of data down (I’m using this type of thing to examine all long running queries during a specified time frame.) It helps to toss everything into a temp table first then parse out the xml. Doing this took my query times from 20+ minutes to 1 minute. I’m sure there are even faster ways of parsing.
SELECT CAST(event_data AS XML) event_data_XML, *
into #testxmlparse2
FROM sys.fn_xe_file_target_read_file
(‘C:\Charles\*.xel’,
‘C:\Charles\*.xem’,
NULL, NULL) T
SELECT
event_data_XML.value(‘(event/@timestamp)[1]’,’Datetime’) AS Timestamp,
event_data_XML.value(‘(event/action[@name=”database_name”]/value)[1]’, ‘nvarchar(256)’)AS [database name],
event_data_XML.value(‘(event/action[@name=”database_id”]/value)[1]’, ‘nvarchar(256)’) AS Database_ID,
event_data_XML.value(‘(event/data[@name=”object_id”]/value)[1]’, ‘int’) AS OBJECT_ID,
event_data_XML.value(‘(event/data[@name=”object_type”]/value)[1]’, ‘nvarchar(64)’) AS object_type,
event_data_XML.value(‘(event/data[@name=”cpu_time”]/value)[1]’, ‘int’) AS cpu,
event_data_XML.value(‘(event/data[@name=”duration”]/value)[1]’, ‘int’) as Duration,
event_data_XML.value(‘(event/data[@name=”logical_reads”]/value)[1]’, ‘int’) AS reads,
event_data_XML.value(‘(event/data[@name=”writes”]/value)[1]’, ‘int’) AS writes,
Null AS QueryID,
event_data_XML.value(‘(event/data[@name=”statement”]/value)[1]’, ‘nvarchar(max)’) as Statement,
event_data_XML.value(‘(event/action[@name=”sql_text”]/value)[1]’, ‘nvarchar(max)’) AS sql_text,
event_data_xml.value(‘(event/data[@name=”object_name”]/value)[1]’, ‘nvarchar(256)’) as StoredProcedureName,
event_data_XML.value(‘(event/action[@name=”username”]/value)[1]’, ‘nvarchar(128)’) AS user_name
FROM
#testxmlparse
GO
If you are getting a negative value when converting your query hash you can use plan_handle instead. Which you can also get from the sp_BlitzCache
The negative value when converting query_hash is still active
https://connect.microsoft.com/SQLServer/feedback/details/888204/sql-server-extended-events-query-hash-predicate-does-not-accept-negative-values
Below is the converted version using plan_handle
CREATE EVENT SESSION [query hash] ON SERVER
ADD EVENT sqlserver.sp_statement_completed(
ACTION(package0.collect_system_time,
sqlserver.client_app_name,
sqlserver.client_hostname,
sqlserver.database_name)
WHERE ([sqlserver].[plan_handle]=0x06000600F42CFC1E80C721CB0100000001000000000000000000000000000000000000000000000000000000)),
ADD EVENT sqlserver.sql_statement_completed(
ACTION(package0.collect_system_time,
sqlserver.client_app_name,
sqlserver.client_hostname,
sqlserver.database_name)
WHERE ([sqlserver].[plan_handle]=0x06000600F42CFC1E80C721CB0100000001000000000000000000000000000000000000000000000000000000))
ADD TARGET package0.asynchronous_file_target
(SET filename = ‘C:\temp\XEventSessions\query_hash.xel’,
metadatafile = ‘C:\temp\XEventSessions\query_hash.xem’,
max_file_size=5,
max_rollover_files=5)
WITH (MAX_DISPATCH_LATENCY = 5SECONDS);
GO
Nice trick, RATG, you should post this as a work around on the connect item as well.
When using plan_handle it will be unique per session.
There is also a column called query_hash_signed, this can be used when you get negative value after converting the query_hash.
This worked for me.
CREATE EVENT SESSION [query hash] ON SERVER
ADD EVENT sqlserver.sp_statement_completed(
ACTION(package0.collect_system_time,
sqlserver.client_app_name,
sqlserver.client_hostname,
sqlserver.database_name)
WHERE ([sqlserver].[query_hash_signed]=(-7930749122386042884))),
ADD EVENT sqlserver.sql_statement_completed(
ACTION(package0.collect_system_time,
sqlserver.client_app_name,
sqlserver.client_hostname,
sqlserver.database_name)
WHERE ([sqlserver].[query_hash_signed]=(-7930749122386042884)))
ADD TARGET package0.asynchronous_file_target
(SET filename = ‘C:\temp\XEventSessions\query_hash.xel’,
metadatafile = ‘C:\temp\XEventSessions\query_hash.xem’,
max_file_size=5,
max_rollover_files=5)
WITH (MAX_DISPATCH_LATENCY = 5SECONDS);
GO
I saw an article on using the event named sql_statement_completed to capture a query or SP containing a specific text. In that case, it was “HAVING”.
https://docs.microsoft.com/en-us/sql/relational-databases/extended-events/quick-start-extended-events-in-sql-server?view=sql-server-ver15