
When is a “Full Scan” not a Full Scan?
The performance counter “Full scans/sec” sounds pretty scary. If you see spikes in this counter, you’re likely to think that your queries are madly scanning all the data in your tables– there are no stylish, well performant seeks, just drunken queries spewing IO everywhere.
If you look up the counter in SQL Server Books Online, it seems to confirm that. Full Scans/sec is defined as the “Number of unrestricted full scans per second. These can be either base-table or full-index scans.” It’s not just a FULL scan, it’s “unrestricted.” That’s sounds really bad, right?
Not necessarily.
Let’s take a look. You can warm up your test SQL Server instance and restore your favorite sample database to play along with the sample queries below using the AdventureWorks2012 database and perfmon.
Test 1: A full scan
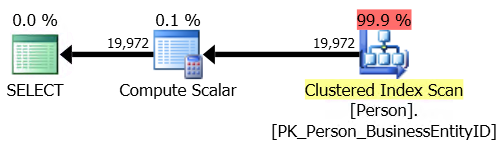
Here’s our first test query. This query technically does an index scan, but it’s a very efficient partial scan– it uses just 3 logical reads to hop to the end of the index and grab the last value.
|
1 2 3 4 5 |
--This will run 500 times declare @val1 int; select @val1=max(BusinessEntityID) from Person.Person; GO 500 |
500 of these finish in less than one second. Here’s what the plan looks like. (If you look deep into the properties of the scan operator, you’ll find that it says that it’s a special “Backwards” scan for speed.)

In perfmon, I can see that this query did the following:
- 500 Full Scans/sec (SQL Server:Access Methods)
- 1,908 Page lookups/sec (SQL Server: Buffer Manager – this is logical reads)
- 0 Page reads/sec (SQL Server: Buffer Manager — this is physical reads and the data was already in memory)
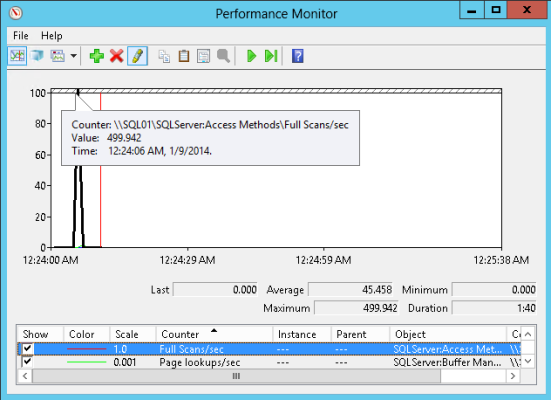
Hmm, so what we’ve seen here is that we can make the full scans/sec counter spike with a scan that isn’t really “unrestricted” or “full” in the way that we might think.
Full scan does NOT really mean that it read the entire index! (I’m not the first to discover this, of course. Michael J Swart gives a nice example of a TOP query doing something similar in this post on different types of scans.)
Test 2: a “worse” full scan
Let’s make our test query a bit nastier. This new version of the query is not such a great citizen — it reads 3,820 pages on each run (as opposed to 3 reads from the query before):
|
1 2 3 4 5 |
--The variable here is just to keep SSMS from choking on the output declare @val1 xml; select @val1 = AdditionalContactInfo from Person.Person; GO 500 |
This is also a scan but it does more IO. 500 of these take five seconds or so– much longer. Here’s the plan:
When we run this, we see that:
- Full scans/sec only spikes up to a max value of 97 this time– it’s much LOWER, even though we hit the SQL Server with a nastier query. We just ran this from a single SQL Server session, so it didn’t spike up as much and took longer– but it certainly isn’t better than the first query.
- Page lookups/sec spikes up to a max value of 362,161. Each run of the query is doing more logical IO– and the fact that this query does more work shows up much more clearly here.
- Page reads/sec just has a slight bump and at one point 8 reads/sec are registered. The data was already in memory, so this wasn’t really impacted at all.

The “worse” query didn’t spike the full scans/sec counter, but it did more IO. If we were designing monitoring around the full scans/sec counter then we’d probably just throw an alert on the incident that actually had less impact.
Pulling it all together
Monitoring is a tricky business. Performance counters tell you a lot about SQL Server– but if you monitor on individual thresholds on many performance counters, you’ll end up with false alarms and more questions than answers. The counters shown in this post can be useful for baselining, trending, and interpreting in a larger context of information, but by themselves they don’t tell you a full story.
If you’re getting frustrated with perf counters and want to learn what’s really dragging down your SQL Server, check out our free webcasts, our free scripts, or our performance tuning training videos.

9 Comments. Leave new
That’s informative. However, wouldn’t perfmon only be useful for diagnosing this if that was the only query running? Is there a way to get perfmon counters for a single session? Can you use something else (e.g. extended events, looking at the popup box when you hover over the scan in the query plan window, etc) to get the number of reads the scan took?
Yeah– I don’t think perfmon is super useful for this.
From a performance tuning perspective, I’m typically biased towards looking at the plan cache first for queries with high average logical reads. (Simple version of the query is here: https://www.brentozar.com/responder/get-top-resource-consuming-queries/). It’s not foolproof, but it’s so lightweight and quick.
From a monitoring perspective, I don’t recommend the counters in this post– I’ve had much better success with the application watching query time and logging when it exceeds allowable levels. I have worked with one company where any query that approaches the five second mark is flagged for review, because they’re so sensitive to latency.
Most SQL Server monitoring products let DBAs create “test transactions” at this point and monitor the runtime of them, so even if the application isn’t built wisely then some version of a “canary transaction” can be used. And there are some counters which can be helpful when checked over multiple samples, too. (Disk latency counters, locking/blocking, etc).
I wrote this post because lately I’ve come across several instances of folks monitoring using the full scans/sec counter and being confused by it.
Also, what would you do if you saw 1000 full scans per second even if you knew they were scans reading all rows? Nothing because those might just be scans of dozens of rows. Not actionable. Does not even raise suspicion.
Yep, exactly. I think this counter is more of a distraction than anything in most production environments.
I found this counter useful for comparisons. In my prod env, there was higher cpu usage after a release, the before/after numbers for batch request/sec were about same, but full scans as well as index scans were significantly higher. I interprete that as higher activity initiated by the app. there may be same number of batches as before but each batch now may have more sql statements in it.
Geoff – hmm, that’s an interesting interpretation, but might not be correct. For example, what if the developers had changed their queries such that they added additional fields to their SELECTs? Indexes that used to be covering might no longer help, and the plans might result in clustered index scans instead.
I agree Kendra. I take scans/second with a grain of salt.
I’ve seen nHibernate apps generate lots of queries that do table scans. But some of the tables are less than a few pages in length. I think that’s skewing the results.
I got full scans more than 5k per second , but its on secondary server who had readable secondary in alwayson
I searched for root cause but unable to find , what you think about it.
Samm – read the post.