
The plan cache holds a lot of secrets about what’s going on inside SQL Server. In the First Responder Kit we shared one of our plan cache scripts to find the top resource consuming queries. That query works well, but over time we’ve added some additional functionality to the query. I figured it was time to share the new query that we’re using to analyze SQL Server performance.
Our existing query looks at individual query stats, but it doesn’t take into account stored procedure or trigger execution stats. During our SQL Critical Care® checks, we’ve found it helpful to look at both procedures and triggers to figure out if they were causing problems for overall server health.
What Are We Looking At?
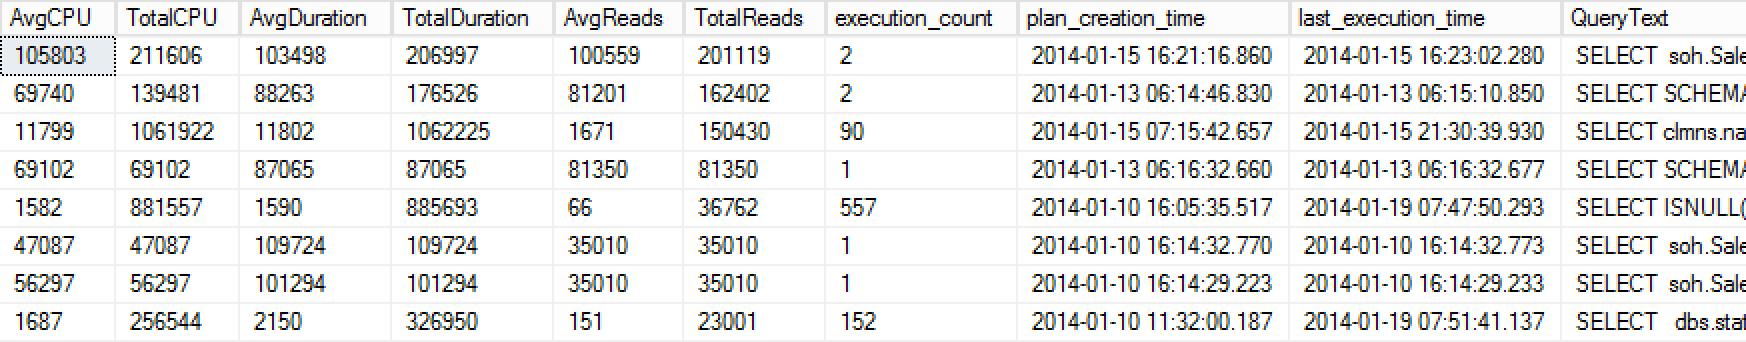
The original query just looked at sys.dm_exec_query_stats and looked at average and total metrics across CPU, duration, and logical reads.
This was a helpful approach, but over time it’s become apparent that we needed to look at more than just individual statements – what if a single procedure was causing problems that only show up in aggregate?
The Bigger Picture
To get a view of the bigger picture, we added in two more DMVs – sys.dm_exec_trigger_stats and sys.dm_exec_procedure_stats. This gives us a big picture view of what’s going on inside SQL Server – the only thing that would make this better would be a DMV for function execution stats.
To avoid skewing results, data is aggregated by the query_hash – unfortunately this means the queries won’t work against SQL Server 2005. Not only do we rank queries by CPU, IO, duration, and execution count, but a second level of ranking is provided that ranks queries within their logical grouping – by statement, procedure, and trigger. If you want to see what your most expensive trigger is doing, it’s easy enough to make a quick change to the query.
Check it out:

Try it out – get sp_BlitzCache® in the usual way – by agreeing to our crazy terms of service, selling your email address to a foreign government, and clicking “download”.
Using the Query
This query is easy enough to start using right way – just download the file and run it. Once you’re familiar with it, scroll to the bottom and you’ll see two separate queries you can run. The first is suitable for pasting into Excel – it has no query plan and the SQL text is shortened to easily paste into a single cell. The second query has everything that you want.
Since data is dumped into a temporary table during analysis, it’s easy to keep re-querying the temporary table as you re-sort data or refine what you’re looking for.

7 Comments. Leave new
As I see for statements this script always says ‘– N/A –‘. Indeed sql_handle may not store the db info, but wouldn’t it be better if database name is shown, whenever it is possible (e.g. looking for dbid returned from sys.dm_exec_plan_attributes)? When I ran this query against our dev server, I saw 100 times ‘– N/A –‘, which wasn’t very helpfull 🙂
That’s a great suggestion.
Unfortunately, the plan itself doesn’t contain the database information – each data access operation in the execution plan can be on a separate database. How would you return data to users for a query that hits more than one database?
Update I just read up on the plan attributes DMV and I’ll be testing that out later.
Of course, database name is not always available, but queries in my backyard almost never hits multiple databases 🙂
I modified your query and replaced the database name in statements part with this:
isnull((select db_name(cast(value as int)) from sys.dm_exec_plan_attributes(qs.plan_handle) where attribute = ”dbid”), ”– N/A –”) AS DatabaseName,
In my case, this gives me much more helpful results. There are other possibilities to get some database name related to this plan, but I don’t trust my (very limited) knowledge to write something more reliable.
Neat! The plan attribute “dbid” is something I learned recently as well. It happened to be a lesson I learned in the comments of a similar post http://michaeljswart.com/2013/09/my-queries-for-top-20-resource-hogs/. (BTW Jeremiah, check out the copyright there)
Before I learned about the plan attribute, I would take the sql plan xml for the first mention of a database. That arbitrary database name was good enough for our purposes.
Hi,
What is the meaning of the * weight columns and how should they be used?
thx
It’s an arbitrary metric of query awfulness. It’s currently a rough estimate of how much percent of resources are being consumed by the query, but it’s not accurate for a variety of reasons. CPU weight of 11 is 1 more awful than CPU weight of 10.