
Problem: your database server’s performance stinks like Limburger cheese.
Solution: find the queries that are making that smell.
Hiding in Plain Sight
Your database server knows exactly which queries are performing the worst. When queries are executed, the execution plans – and associated execution statistics – are stored in memory (with a few exceptions). This information is stored in the plan cache, and you can access it by querying a couple of DMVs.
We even have a script on our website that can help you with that.
One way you can get this information is to run this query in SSMS. But what if you wanted it on a regular schedule, like every Monday morning, so you knew what queries hit your server the hardest in the last week? What if you wanted developers to have access to this information, without letting them run wild in SSMS?
Write a report!
Building a Basic Table Report
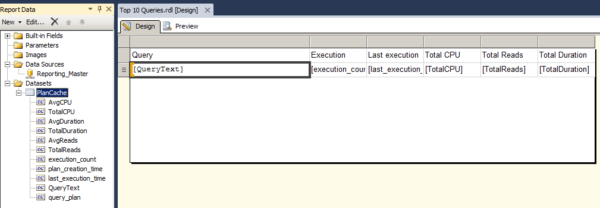
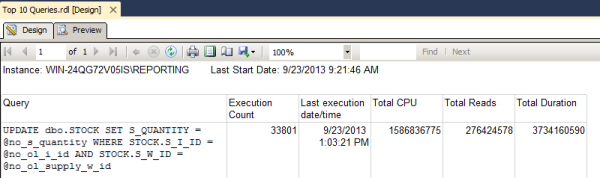
The most basic way to display information in SQL Server Reporting Services (SSRS) is by using a table. I’m going to go into Report Designer, add a new data source to connect to my instance, use a slightly modified version of the above query to return the top 10 queries by total CPU, and add a table to the report.
Here’s my design:
And here’s a preview of it:
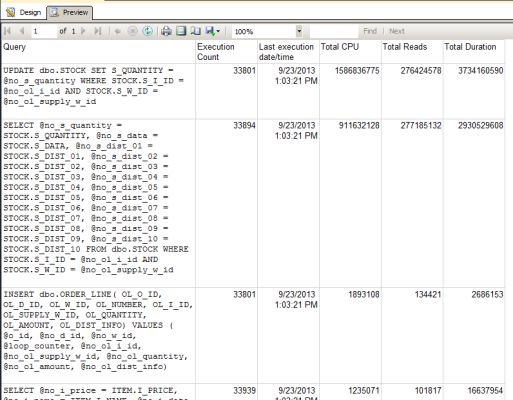
It’s functional, but it could be better. Some of the things I’d like to see in this report:
- The time the service started. The plan cache is only good from the time of the last restart (or the last time the plan cache was cleared, but I hope you’re not doing that on a regular basis).
- Formatting. Some of the numbers are hard to read, and it’s ugly. No one wants to look at ugly data.
- Measurements. Is that CPU in milliseconds? How about the duration?
- Can I get a link to the execution plan?
Improving the Report
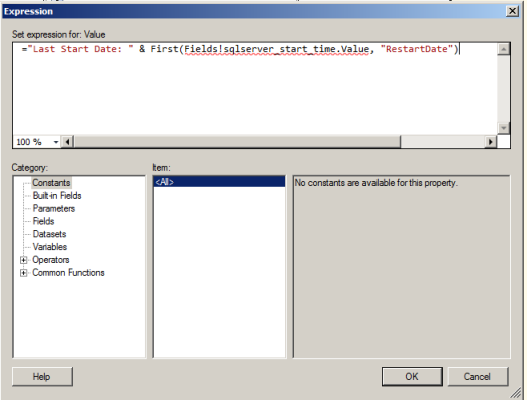
I’m going to add a header to the report to display the last restart date. I add a new dataset which queries sys.dm_os_sys_info for the last start time. I add a header to the report, and add a textbox. I build an expression to display the last start time.
The report looks sharper already!
To display the rest of the information, I’m going to use the list control – I think it’s one of the most under-used features of SSRS. A list lets you add multiple report elements – text boxes, tables, images – to one space and arrange them as you wish. The list starts with two textboxes, one for the number of executions and one for the last execution date. Since I’m combining text and data, I use expressions.
Then I add a table to display the CPU, reads, and duration. I make sure I add appropriate labels for the measurements. I also format each of the results as a number so the numbers have commas in them.
Then, I add another textbox, display the query text, and format it with a fixed-width font so it’s easier to read.
Here’s the design:

Here is what the report looks like when run:
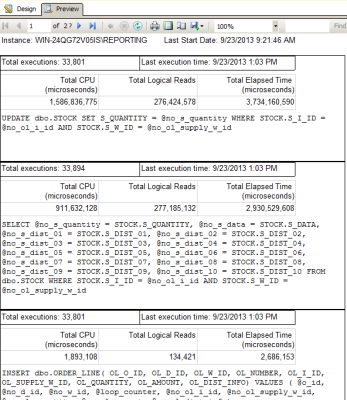
That’s a lot easier to read!
I’ve knocked everything off my list except the execution plan. I’m going to add another text box and add the plan.
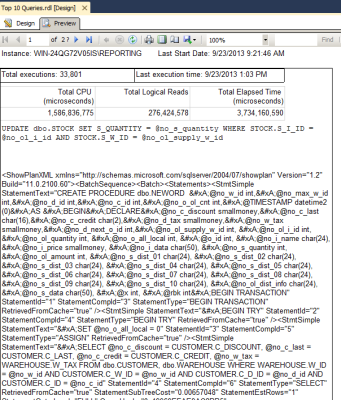
That is not readable. Here’s the issue: the plan is stored as XML, and SSRS can’t natively display XML. I could leave this here for a user to copy and paste into SSMS or SQL Sentry Plan Explorer, but that’s a lot of work. I decided to take it out of the final version of my report.
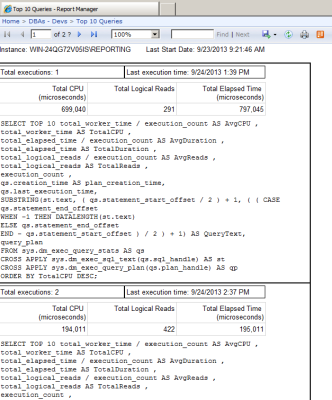
The last step is to deploy this to Report Manager. After I deploy it, users that have permissions to the folder it’s deployed to can view it – without having to go into SSMS or coming to me for the information. They can also subscribe to it to receive a copy on a regular basis.
The next step to be taken: tune those queries!
SSRS can be used to solve a variety of issues – it isn’t solely the realm of analysts that need to know the sales from last quarter or what products are the most profitable.

5 Comments. Leave new
Well done Jes! DMV query statistics and reporting services are a match made in heaven (or maybe Richmond)
I love SSRS for this purpose, I remember the first time Reporting Services was not an exercise in wrestling with different settings: 2008 saw a huge jump in usability. It prompted one of my earliest blog posts ever Reporting Services is Fun Again
I regularly mine the ReportServer tables for performance and usage data so my organization can keep our reporting solutions in good shape. Thanks for giving me another tool in my toolbox!
Thank you for a great post, however, I am wondering if you have a copy of the slightly modified query that you used to get the top 10 queries.
Aaron – sure, start here instead: https://www.brentozar.com/blitzcache