
I came across an interesting case recently where queries were failing in a high transaction SQL Server. We knew that queries were occasionally failing with error severity 20 because SQL Server Agent alerts were periodically firing. However, those built in alerts don’t capture exactly what has failed– they just say “Something failed big. Good luck with that.”
This particular SQL Server instance runs thousands of batch requests each second. The errors would occur every hour or so at the most. This made things a bit tricky. Popping open SQL Server Profiler would have been a hot mess for performance.
What to do to find the query in distress?
Extended Events
The instance in question was running SQL Server 2008R2. This meant that Extended Events were an option. I’m open to using Extended Events, but it’s not generally my first choice. Sure, it’s a cool feature, but it tends to be time consuming to design, script, and test Extended Event sessions and then query the results. Let’s face it, Extended Events are a hornets nest full of angry XML.
In this case, however, Extended Events turned out to be pretty handy. The built-in System Health Extended Events trace already captures information for queries that fail with Severity 20 and higher– so the data was just waiting to be queried.
I Was Born to Write XQuery
That’s a lie. I figured out pretty fast that the System Health trace held the answer I wanted, but my search-engine-fu didn’t help me query exactly what I wanted. Getting the query just right was, in typical Extended Events style, a bit of a headache. I figured I’d share the information here, because you probably weren’t born to write XQuery, either. (If you were, you are probably a demon robot.)
Severity 20 Errors and Higher: System Health
If you need to query high severity errors from System Health, this query is a good place to start. The gist of the query is that you’re looking for rows in the System Health of the type error_reported. We shred out columns to display error severity, error number, error message, and (hopefully) the associated sql text, if it was captured.
Test this outside of production first. Monitor its runtime carefully: it can take a bit of time on a busy, large system. I use the temp table here for a reason– it helps SQL Server with estimates for the second query (row and cost estimates get pretty wacky in some cases if you use a CTE or a derived table).
|
1 2 3 4 5 6 7 8 9 10 11 12 13 14 15 16 17 18 19 20 21 |
SELECT CAST(target_data as xml) AS targetdata INTO #system_health_data FROM sys.dm_xe_session_targets xet JOIN sys.dm_xe_sessions xe ON xe.address = xet.event_session_address WHERE name = 'system_health' AND xet.target_name = 'ring_buffer'; SELECT DATEADD(mi, DATEDIFF(mi, GETUTCDATE(), CURRENT_TIMESTAMP), xevents.event_data.value('(@timestamp)[1]', 'datetime2')) AS [err timestamp], xevents.event_data.value('(data[@name="severity"]/value)[1]', 'bigint') AS [err severity], xevents.event_data.value('(data[@name="error_number"]/value)[1]', 'bigint') AS [err number], xevents.event_data.value('(data[@name="message"]/value)[1]', 'nvarchar(512)') AS [err message], xevents.event_data.value('(action[@name="sql_text"]/value)[1]', 'nvarchar(max)') AS [query text], xevents.event_data.query('.') as [event details] FROM #system_health_data CROSS APPLY targetdata.nodes('//RingBufferTarget/event') AS xevents (event_data) WHERE xevents.event_data.value('(@name)[1]', 'nvarchar(256)')='error_reported'; DROP TABLE #system_health_data; GO |
Catching Other High Severity Errors: Preparation
The query above is great, but not every error is Severity 20 or higher. What if a query is failing with Severity 16? While we’re at it, it might be good to check for those, too.
Since we went ahead and did the hard work on writing the query to display things in a nice way, it’s not a lot of extra work to adapt it. We do have to set up a custom Extended Events trace, though, because System Health filters for error severity 20 and higher.
Before you ever create a new Extended Events session, test it out on a non-production server first. No, really, just do it.
First, make sure to check out what Extended Events Sessions are running on your SQL Server:
|
1 2 3 |
SELECT * FROM sys.dm_xe_sessions; GO |
If more than the System Health and sp_server_diagnostics sessions are running, find out what the sessions are being used for and what’s up. You don’t want to trace yourself to death.
Set up the Extended Events Session
Here’s our goals: We’d like to catch all errors higher than a severity of 10. We want to stream the errors to a file stored on our SQL Server asynchronously. We can do that with a script like this. The script defines the Extended Events session and then starts it.
You must change directories for where the files are stored
|
1 2 3 4 5 6 7 8 9 10 11 12 13 14 15 16 17 18 19 20 21 |
--Create an extended event session CREATE EVENT SESSION what_queries_are_failing ON SERVER ADD EVENT sqlserver.error_reported ( ACTION (sqlserver.sql_text, sqlserver.tsql_stack, sqlserver.database_id, sqlserver.username) WHERE ([severity]> 10) ) ADD TARGET package0.asynchronous_file_target (set filename = 'S:\XEventSessions\what_queries_are_failing.xel' , metadatafile = 'S:\XEventSessions\what_queries_are_failing.xem', max_file_size = 5, max_rollover_files = 5) WITH (MAX_DISPATCH_LATENCY = 5SECONDS) GO -- Start the session ALTER EVENT SESSION what_queries_are_failing ON SERVER STATE = START GO |
If you’re testing this outside of production like you’re supposed to, you may want to generate some errors for testing purposes. You can do that with simple queries like this one. (Good news, if you don’t have AdventureWorks2012, it’ll still throw an error. Win/win?)
|
1 2 3 4 |
use AdventureWorks2012; GO select * from Person.Person where ModifiedDate='20aaa'; GO |
This results in a level 16 error:
Msg 241, Level 16, State 1, Line 1
Conversion failed when converting date and/or time from character string.
To make sure your trace is working, you may query from the files that are collecting data. You can query this live, while the files are being written to. You can also copy the files off to another location and query them elsewhere.
You must change directories for where the files are stored
|
1 2 3 4 5 6 7 8 9 10 11 12 13 14 15 16 17 18 19 |
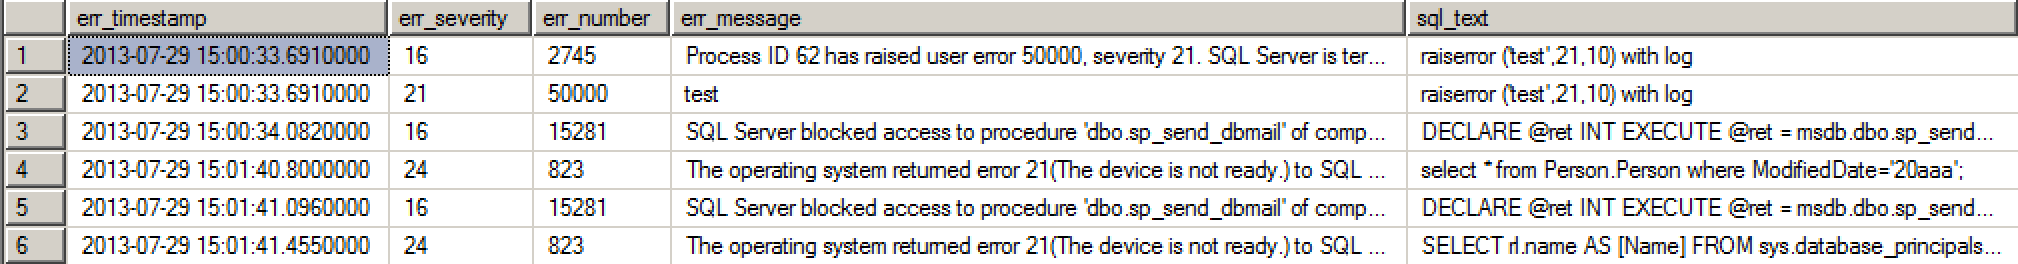
;with events_cte as( select DATEADD(mi, DATEDIFF(mi, GETUTCDATE(), CURRENT_TIMESTAMP), xevents.event_data.value('(event/@timestamp)[1]', 'datetime2')) AS [err_timestamp], xevents.event_data.value('(event/data[@name="severity"]/value)[1]', 'bigint') AS [err_severity], xevents.event_data.value('(event/data[@name="error_number"]/value)[1]', 'bigint') AS [err_number], xevents.event_data.value('(event/data[@name="message"]/value)[1]', 'nvarchar(512)') AS [err_message], xevents.event_data.value('(event/action[@name="sql_text"]/value)[1]', 'nvarchar(max)') AS [sql_text], xevents.event_data from sys.fn_xe_file_target_read_file ('S:\XEventSessions\what_queries_are_failing*.xel', 'S:\XEventSessions\what_queries_are_failing*.xem', null, null) cross apply (select CAST(event_data as XML) as event_data) as xevents ) SELECT * from events_cte order by err_timestamp; |
Here’s what a bit of the output looks like on my test VM, which is a hotbed of terrible errors:
Clean up Your Extended Events Trace
This isn’t the heaviest of traces, but it’s always important to clean up after yourself– only trace the minimum amount needed to solve a problem, and turn it off when you’re not using it.
To stop and remove your trace, you’ll need to run queries like this:
|
1 2 3 4 5 6 7 8 |
-- Stop your Extended Events session ALTER EVENT SESSION what_queries_are_failing ON SERVER STATE = STOP; GO -- Clean up your session from the server DROP EVENT SESSION what_queries_are_failing ON SERVER; GO |
Does this Replace Application Logging?
Noooooooooo. Oh, no.
This is a good tool to use periodically to check and make sure logging in your application layer is working well. But the application really should be catching failures, retrying when appropriate, and logging in a way that lets staff know that something is going wrong.
This method doesn’t catch everything you might think of as a “failing query”, either. Application timeouts are a little different. In an execution timeout scenario, the application decides that it’s tired of waiting. It sends a notification to the SQL Server that it’s canceling its query and moving on. That doesn’t get recorded as a failing query in this way.
I don’t think that’s a problem– because it makes a LOT more sense for the application to log errors and timeouts and decide what to do in each case.
Do You Always Need Extended Events?
Oh, heck no!
This can come in handy sometimes, so I’m sharing it. But Extended Events aren’t always the fastest, simplest, or easiest way to solve a problem– particularly if you’re not yet on SQL Server 2012.
If the queries in this post help you out– rock on! But don’t dismiss simpler methods if they get you where you need to go, too. The fanciest way to do something isn’t necessarily the best.

41 Comments. Leave new
Excellent info – thanks for sharing. Out of curiosity, could you summarize what you discovered as to why the query(ies) were failing? Was a database or object damaged?
Oh, sure!
The original error was a querying failing due to NOLOCK/ allocation order scan failing. When looking at lower severity errors as well we found some cases where inserts/updates were failing due to string lengths.
And I guess the application did not report any errors? If it had reported errors you wouldn’t have needed to resort to XEvents.
Yep, in the case in question we didn’t have an easy way to sweep all the application logs.
Totally agree that it’s better/easier to have application logs drive this rather than resorting to XEvents whenever possible.
This just saved me hours of troubleshooting! Thank you Kendra very much!
Awesome, glad we could help!
This is fantastic. I was always “too busy” to get into this particular hornets’ nest but this has inspired me! Thanks for a great post.
First, I have a lot of respect for Jonathan Kehayias, and I feel calling him a demon robot was over the top! His series on XEvents is great – http://www.sqlskills.com/blogs/jonathan/an-xevent-a-day-31-days-of-extended-events/ – and he proves that he was born to write XQuery!!!
I hope to see a lot more posts like yours out there. Although Jonathan throws everything out there, having this type of post where you can say copy/paste this and here’s the issue you’re looking for is a perfect addition to the SQL Server community. It leaves room for people to use code without understanding it, but it also gives people like me code to tinker with until I do.
Thanks to a Twitter conversation about this post, we can all rest easy as there was an overwhelming agreement that *everyone* hates XQuery. Sometimes it takes a common enemy to bring people together, right?
Kendra,
I liked this article! I don’t use the System Health trace enough, and I’m sure that my dislike of parsing XML is a big part of that. 🙂
One quick, geeky clarification question: You mentioned “TDE notification” near the end of your article. I *think* you meant “TDS notification”, but since SQL and related networking protocols aren’t my strong suit, I thought I’d bring it up in case I’d learn something new?
Thanks!
Aaron
Isn’t it actually a “TPS Report”?
I wrote that last bit about the timeouts from memory and I should know better than to trust my recall on acronyms! I’ll update the post, thanks much.
Kendra,
Great article – thanks much.
Per Aaron’s comments about his aversion to parsing through XML: I’m looking for articles, tutorials or whatever that will help me figure out how to wade through – and be able to write meaningful queries! – with the data captured by the trace. I’m a complete noob with XML – any suggestions?
Hey, sorry I missed this a while back.
This isn’t a definitive tutorial or guide, but I really like Erland Sommerskog’s XML examples and notes as part of his “arrays and lists in SQL Server” whitepaper: http://www.sommarskog.se/arrays-in-sql-2005.html#XML
Thanks Kendra – I’ll take a look. Mike
SQL Pass, DBA Fundamentals Virtual Chapter had a great presentation a few weeks ago “XML Without Xanax How to Handle XML in SQL Server”.
The presentation is on YouTube.
https://www.youtube.com/watch?v=_Cd9waBafbw
Or you can get it on the chapter home page at SQL PASS.
It was like drinking from a Fire Hose 🙂
This is disconcerting. I ran the first code sample on one of my newer servers (SQL2008r2; we’re finishing up a migration from SQL2005) and I find 51 rows, all indicating err severity 20. Dates are from 5/2013 through today.
But when I check my Error 20 Severity ALERT, it claims there’s been a total of 1 occurrence, back in Feb 2013.
Server is v10.50.4000, Enterprise Edition. Running 5 named instances, lots of memory and CPU.
What might explain this discrepancy?
What types of things are you seeing that the system health check says happened with error Severity 20?
Hi, thanks for your time… seeing that all but one of these were from MY IP, I will note that virtually all of my SQL access is via SSMS, if that helps.
All rows contained these column/values: err number = NULL and query text = “Unable to retrieve SQL text”. And “err message” was 1 of 2 values (but for timing details and client):
50 rows, all but 8 of these were for [CLIENT: (me!)]
Network error code 0x2746 occurred while establishing a connection; the connection has been closed. This may have been caused by client or server login timeout expiration. Time spent during login: total 363 ms, enqueued 0 ms, network writes 1 ms, network reads 362 ms, establishing SSL 98 ms, negotiating SSPI 0 ms, validating login 0 ms, including user-defined login processing 0 ms. [CLIENT: (me!)]
1 row, for [CLIENT: (me!)]
Network error code 0x102 occurred while establishing a connection; the connection has been closed. This may have been caused by client or server login timeout expiration. Time spent during login: total 105745 ms, enqueued 0 ms, network writes 0 ms, network reads 105745 ms, establishing SSL 105703 ms, negotiating SSPI 0 ms, validating login 0 ms, including user-defined login processing 0 ms. [CLIENT: (me!)]
Ah, interesting! Are there login failures for the time that these errors appear also in the SQL Server error log? I would also expect them to appear there.
Login failures are usually a severity 14, so I’m guessing that’s why the alert hasn’t fired for them. I think that the severity level in system health may not exactly match up with the severity levels we see elsewhere!
Hi Kendra, while my issues wasn’t directly related to this, your article really helped me. Cheers!
John.
Glad to hear it, thanks!
I used your query to find out A read operation on a large object failed while sending data to the client
which comes out with sev 20. But the query_text column is null. Is there any way to find out which query is causing this problem .
Another helpful resource on this! Maybe you could do another fab poster — lost in the badlands of XQuery! Perhaps not.
Thanks Kendra!
Thanks!
Thanks very much for for this insight Kendra. I have a similar question to “MST” of August 2013. I have alerts configured for Sev 20 and above that are not firing for those errors I found when running the query you provided. Does this have to do with the polling interval used by the Alert engine? Seems to me that we should forgo the Alert system in favor of XE unless the trade off is a too heavy handed trace.
Yeah, putting in a trace would certainly be heavier. Ideally the application would catch its errors. Are these coming from an application tier? Or are they from the SQL Server Agent or some internal use?
In this case, the errors were of the connection aborted type like this one:
Network error code 0x2746 occurred while establishing a connection; the connection has been closed. This may have been caused by client or server login timeout expiration. Time spent during login: total 306 ms, enqueued 0 ms, network writes 0 ms, network reads 186 ms, establishing SSL 119 ms, network reads during SSL 119 ms, network writes during SSL 0 ms, secure calls during SSL 0 ms, enqueued during SSL 0 ms, negotiating SSPI 0 ms, network reads during SSPI 0 ms, network writes during SSPI 0 ms, secure calls during SSPI 0 ms, enqueued during SSPI 0 ms, validating login 0 ms, including user-defined login processing 0 ms.
It was just a little disconcerting to find that Sev 20’s were more common than the alert engine was indicating. I was under the impression that errors of severity 20 and above were important enough to investigate.
Do you think its advisable to simply read the contents of the ring buffer populated by the system health XE session periodically instead of relying on the alert system? If the system health XE is running all the time anyway, might it not be best to use that data collected?
I’m not sure I’m convinced it’s a real fatal error and wasn’t retried. Would you not have noticed login failures from the application side?
Not necessarily. There are several non-human users of the database, e.g. workflow and business rule engine logins that occur thousands of times per day, so they would go unnoticed unless the connection failures rose to the level that affected the application. I’m just trying to stay ahead of the curve by reacting to an increase of such failures, hence the sev 20 alerts that I thought were telling the whole story but apparently not.
Ah. I did see these network related events in a case where we had good application logging and could not identify any corresponding failures from the application side. That doesn’t solve your problem, I guess I’m saying my experience said that the XEvents weren’t necessarily authoritative/more correct than the alerts in that case.
Thanks Kendra, great write up! This was a quick way to verify one of our ETL apps wasn’t working correctly vs actually failing on the sql server.
Is there a way to clean up the XML files via SQL as well?
Stephen – you could use xp_cmdshell if you wanted to delete them manually.
Thanks Kendra for this post. Made my day.
Anyone ever had to deal with severity 20 alerts being caused by the error “Network error code 0x2746 occurred while establishing a connection”
And is there any reason the Alert System does not mail the error or the statement triggering the alert?
I am also trying to modify one of the queries to look for only recent events:
AND xevents.event_data.value(‘(@timestamp)[1]’, ‘datetime’))> getdate-7
What am I missing please?
Kenneth – sorry, but we can’t troubleshoot the query remotely. Your best bet is to post the query you’re working on at http://dba.stackexchange.com along with the error you get.
Hi Kendra!
I would like to add application name or login name fields to “sqlserver.error_reported” event to help me find which error belongs to each application. Is it possible?
I’ve scripted out adding some additional fields to that session. Hopefully they’re helpful.
ALTER EVENT SESSION [what_queries_are_failing] ON SERVERDROP EVENT sqlserver.error_reported
ALTER EVENT SESSION [what_queries_are_failing] ON SERVER
ADD EVENT sqlserver.error_reported(
ACTION(sqlserver.client_app_name,sqlserver.client_hostname,sqlserver.database_id,sqlserver.nt_username,sqlserver.session_nt_username,sqlserver.sql_text,sqlserver.tsql_stack,sqlserver.username)
WHERE ([severity]>(10)))
GO
Hi Erik!
Thanks for your help!
Quality articles or reviews is the secret to be a focus for the visitors to
pay a visit the web page, that’s what this web site is providing.
another life saved…
Thank you very , very much!