
I’ve written about how to test your SAN’s performance with SQLIO, but I’ll be honest with you: that’s the hard way. It takes knowledge and time, and you only have one of those. (I’ll be charitable and not tell you which one.) Instead, let’s get seat-of-the-pants numbers for your storage.
Go to the CrystalDiskMark download page, but PAY CLOSE ATTENTION. This is tricky. There are multiple download links – you want CRYSTALDISKMARK, not CrystalDiskInfo, and you want the Standard Edition, Zip Version. The zip version doesn’t require an installer, which is cool because I’m not a fan of installing things on production servers. The zip version can be just saved to a network share, and then anybody can run it from there.
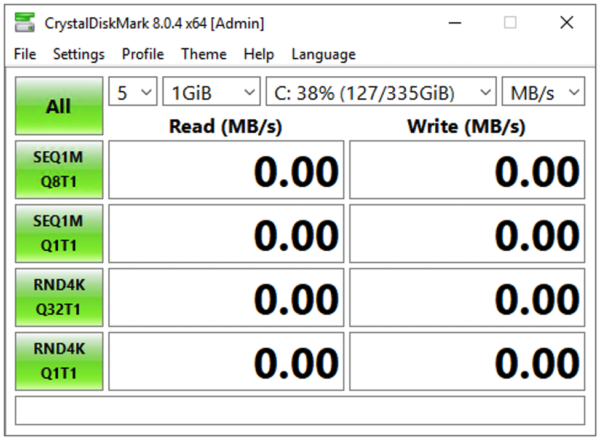
After extracting the zip file’s contents, run DiskMark64.exe on an idle server or desktop first (not your live SQL Server, because it’ll slow things down while it runs.) It’ll look like this:
Across the top, set the first three dropdowns to:
- 1 – the number of test passes you want to run. If you want a fast seat-of-the-pants guess, do 1, but keep in mind it can be wildly variant between passes if something else happens to be going on in the SAN.
- 1GiB – the test file size. If you’re under the gun, do a quick 1GiB test, but for real go-live prep, I like using 32GB to reduce the chances that I’m just hitting cache and getting artificially fast numbers. Smaller test file sizes may look fast but don’t really reflect how a large database will work. Just know that the bigger the test file, the longer it takes to generate.
- M: – the drive letter to test. Keep an eye on the free space there – you don’t want to create a test file that can run your server out of drive space. You want to test where your data, log, and TempDB files live, and for fun, also test the C drive and your desktop or laptop for comparison.
After making your choices, click the All button. While it runs, here’s an explanation of each row’s results:
- SEQ1M Q8T1 – lots of long, sequential operations. For SQL Server, this is somewhat akin to doing backups or doing table scans of perfectly defragmented data, like a data warehouse.
- SEQ1M Q1T1 – ignore, SQL Server doesn’t work like this.
- RND4K Q32T16 – random tiny operations, but many done at a time. This is somewhat akin to an active OLTP server, or a TempDB drive.
- RND4K Q1T1 – Ignore, SQL Server doesn’t work like this.
The more astute readers (and by that I mean you, you good-looking charmer) will notice that 4K operations don’t really measure SQL Server’s IO. SQL Server stores stuff on disk in 8K pages, and zooming out a little, groups of 8 8KB pages (64K extents). We’re not looking to get an exact representation of SQL Server’s IO patterns here – we’re just trying to get a fast, one-button-click-easy measurement of how storage performs. Usually I find that during the first round of storage tests, it’s not performing well period – and it doesn’t make sense to bring SQL Server into the game just yet.
Sample CrystalDiskMark Results
Here’s a sample set of results from a 335GB general purpose SSD volume in Amazon EBS:

Note how you can type in the bottom box of CrystalDiskMark’s results – see how I typed Amazon General Purpose SSD? That’s great for making notes that will be visible in the screen shots to help you determine which test results came from which machine.
And here is a set from an ephemeral SSD locally attached to that same EC2 VM:
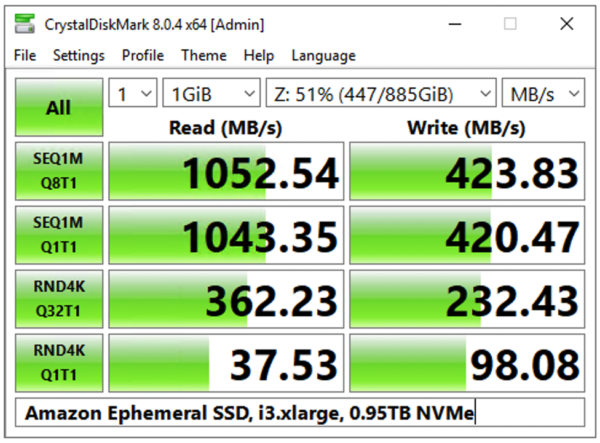
Notice how the ephemeral SSD is 10x-30x faster on reads, and 4x-18x faster on writes? Not to mention that the ephemeral drive is completely free with your VM. You can see why people are tempted to store databases on there, but that’s a discussion for another day.
You can get IOPs, latency, and throughput numbers from CrystalDiskMark too by clicking File, Save Text, then go into a text editor and open the results. The text version of the results has more details:

So what’s a good or bad number? If your server boots from a mirrored pair of local drives, and stores its SQL Server data somewhere else (like on a larger array or on a SAN), then test the local mirrored pair too. Compare the numbers for where you’re storing the valuable, high-performance data to where you’re storing the OS, and you might be surprised. Often I find that the OS’s drives perform even better because we just haven’t configured and tuned our storage.
Keep these original CrystalDiskMark screenshots in a shared folder for the group to access, and then challenge everyone involved to do better. Simple tuning techniques like tweaking the read/write bias on the RAID controller’s cache, right-sizing the NTFS allocation units, and working with different stripe sizes can usually yield double the storage performance without spending a dime.

109 Comments. Leave new
So did you get the turbo Jetta ?
Thanks for sharing measuring performance technique
The key to a successful relationship is … actually, I have no idea what it is, but it’s on the same keyring as the car your girlfriend wants. We got the Turbo.
This may be one of the most profound thoughts I have ever read.
My hard drive results
Seq1m (q8t1). 33.35./ 28.94
Seq1m (Q1t1). 33.56/ 28…..
Rnd4k 0.59/1.11
Rnd4k. 0.31 1.10.
Not sure if its bad or good.
terrible!
“modern” hard disk drives on 7200rpm (just talking about SATA here) usually are above or at least on 200.00 for SEQ1M(Q8T1), to compare: My Seagate Exos 18TB shows something around 223 MB/s for this test with a 1G datasize.
Another comparison, my external backup disk, a Seagate BackupHub+ connected through USB is pretty much exactly 200.00 MB for the same test (and parameters)
33.35 MB/s read speed on a sequential simple access is something so low that I never seen it in practice, unless I accidently tested an old slow USB2 stick or something.
Are you sure this is really your hard disk drive? And have you actually made sure you didnt test in NVMe mode ?
If everything is real, then I would check the SMART data of this drive asap – could be an already failing drive…
I get about the same and suspect the USB is in 2.0 mode rater than 3.0
Brent, thanks for the helpful articles I really appreciate them. I just ran this on the data drive of a new win2k8r2, SQL 2008 r2 OLTP test cluster. Here are the numbers. I think they look OK but not 100%sure. Thoughts?
Thanks in advance.
seq 211.3 244.5
512K 214.6 192.7
4K 5.113 13.77
4K
QD32 366.9 142.8
Hi, Bryan. Something about that seems off – you shouldn’t usually higher speeds for 4k QD32 reads than you see on sequential reads. Make sure you follow the instructions in the post carefully with the number of test passes and the size of the test file. If the results repeat, I’d be interested to hear more about the server and the storage involved.
I ran it a few more times with 5 passes at 4000MB and hit a range if 350 to 400MB/s. Sequential reads were 50-100MB/s faster.
We are using HP Proliant servers and an IBM SAN. Looking in Device Manager I can see that we have Qlogic fiber HBA’s, driver date 11/17/2010, seems kind of old. I have a meeting later today with the storage admins and will ask more questions 🙂
Thanks
Bryan
Actually that isn’t too bad – I too use QLE2460’s and the driver date is 12/2/2009. No issues to report – they are performing as expected. Do you have the SANsurfer HBA Manager installed? If so you can glean some pretty good performance related information from it. Since I’m tied into an EMC, I do use PowerPath as well.
Hi Allen, SANsurfer is not installed. We have an IBM DS5300 with 300GB 15k disks. Here is what out storage admin has to say about the configuration. This is from an e-mail that was sent to me.
Test has 13 raid-5 raid groups of 7 drives each.
Prod has 22 raid-5 raid groups of 7 drives each
Each raid-5 raid group is presented to the SVC as a lun. Then the SVC combines all of these luns into a managed disk group (or a pool in version 6) which then vdisk are “carved” out for each host. The vdisk is striped across multiple luns in a managed disk group.
Hard to picture, but the disk that the host “sees” is actually striped twice, (once by the svc and once by the raid-5 raid group on the actual disk array.
I don’t know if that is good or bad for database storage.
Bryan – sorry I was out for a while, and I’m rereading this, but I’m not sure if there’s a question in here or if you’re just sharing knowledge?
This is a great little tool! I’ve already run some tests with it.
I’ve used your SQLIO tutorial to test my servers / SAN before.
Do you have any thoughts or guidelines on how to compare / contrast the results from both methods?
Steven – I don’t usually compare/contrast the results from the two tools. I use CrystalDiskMark as a fast “easy button” for people to do quick throughput testing, and then if time allows, I use SQLIO to do much more in-depth testing.
I actually took your SQLIO post and automated it a bit more, putting a nice SSRS front-end on it so I can easily identify saturation and things of that nature, but I’m all for a tool that can get me some quick numbers as well. Thanks, Brent.
I have an 11 year old Turbo Jetta. It makes my wife’s Honda Accord seem like a golf cart or a BlueArc SAN.
How useful is this tool for testing I/O performance on virtual machines with all their storage on virtual disks on the SAN?
Jeff,
IOPS are IOPS regardless of whether the storage is local or a SAN. If you drop a file on to a drive and read/write to it, the speed at which you can read/write is what you are testing regardless. The one kicker with a SAN – and Brent alluded to it – is the cache. You want the file to be big enough to know you aren’t just hitting the cache, but rather are hitting the disks.
Very! It gives you insight into what the disk performance is like for that guest with its given storage configuration. Now, whether or not your virtual disk configuration is what’s slowing you down is a different story– you’d need to investigate to confirm how much of a difference that was making.
I really thought you were going to post some numbers here but it turns out you’re just a tease :]
I’ve been considering starting a “san users anonymous” since these vendors hate it when people talk actual numbers. Maybe they have a point but the response shouldn’t be to shut people up, it should be to help them get the best performance.
For vmware there is a beta tool “IO Analyzer” that people are posting all kinds of results here: http://communities.vmware.com/message/1780088#1780088
And for the question, “Does this matter in VMs?” I would say it does more, because that is another layer where you could have an ill advised setting holding you back.
Dustin – yep, ideally there’d be some kind of Geekbench-style repository for storage data. When I was a SAN admin, I found that to be extremely difficult, though, because it depends on so many variables. There’s the number of drives, the make/model of drives, the RAID controller or storage processor, how the storage is connected, the stripe size, the NTFS allocation unit size, multipathing software, and of course version numbers for everything involved. It’s hard to compare apples to apples with complete strangers in the storage world.
I would agree that while there are a lot of variables, most all of them have metrics and theoretical expectations – from the drives, controllers, ports, cables, switches, HBA’s, etc. A baseline has to established by collecting and analyzing the theoretical capabilities taking into account the configuration. I spent nearly three days reading up on every piece of literature I could find on my hardware before I even started to run tests because the tests mean nothing without some sort of expectations to match the results up against.
Allen – yep, but to share benchmarks publicly, you’d have to include all of the variables. Otherwise, it just dumbs down to, “I have storage and it can read 400MB/sec.” While that *is* useful to you, it’s not terribly useful to the public.
While I share what I’ve gathered, I mostly do that so I can be corrected in the event I interpreted something wrong. This was my first ever attempt at using SQLIO, using your post as a guideline (I believe you saw it, but so others know what I’m talking about):
http://allen-mcguire.blogspot.com/2011/12/sqlio-testing-round-1.html
I personally do that because I’m a numbers/math person and feel that’s the only way to make sense of the output using these sorts of tools. Knowing I’m getting so many IOPS or throughput does me absolutely no good personally unless I can confirm or deny that it’s meeting the theoretical expectations. If I’m getting 400MB/sec, but the theoretical throughput is 600MB/sec, I know something isn’t right and will dig until I find out why I have a gap in expectations and results.
Something worth mentioning is that using CrystalDiskMark in this manner only tests the maximum throughput of your SAN. If you’re using iscsi, you may only see a maximum of 165MB/s or so due to the limits of 1gig ethernet.
That doesn’t necessarily mean your SAN is slow though. If you’re using MPIO and have lots of fast disks, you can still serve a very large number of IOPs.
I use CrystalDiskMark quite a bit. In my experience, the main numbers you want to look at / optimize for are sequential reads for table/index scans, and something in between the 512K and 4K random reads for the rest of an OLTP workload.
Although there are exceptions of course, most apps running in SQL Server don’t seem to generate a queue depth of anywhere near 32 on a single LUN, so I prefer the QD=1 numbers as a first-cut guide.
BTW, there’s a text box at the bottom of the form that you can use to describe the test environment/date, etc — that way you can capture that info in your screenshots, rather than relying on file names.
Okay, Correct me if I’m wrong or if my question makes no sense.
So Linchi Shea blogged about the importance of fewer and defragmented VLFs for transaction log files (especially for dbs that support a lot of large bulk operations). Is that because we want the write behavior of the TLog file to be as close to the number reported by crystal disk mark as “Sequential” writes? (MB/s).
As a follow up question. Can we use slow average write stalls (calculated from info in sys.dm_io_virtual_file_stats) as a symptom of too-many-VLFs?
Maybe the questions don’t make sense. Any help or links are appreciated.
Michael – well, no, not really. The VLF thing has less to do with disk fragmentation and more to do with the way SQL Server manages virtual log files. We do want the write behavior of log files (and data files) to be as high as possible, but realistically, it’s pretty hard to get SQL Server to crank out the same kind of pure sequential throughput that we can get with synthetic tests. If we have exactly one database, and we’re not doing t-log backups as we’re loading, then it’s possible to get close. Problem is, multiple databases’ log files on a shared log file drive, plus transaction log backups going on at the same time, mean that we end up doing a lot of random access anyway.
I wouldn’t directly draw a line between too many VLFs and slow write stalls. That’s totally possible – I just haven’t done that measurement. The two things are easy enough to measure independently – you can easily check VLF count with Dave Levy’s scripts at http://adventuresinsql.com/2009/12/a-busyaccidental-dbas-guide-to-managing-vlfs/ and if it’s high, then we shrink & regrow the log files to correct it. I measure storage stalls with sys.dm_io_virtual_file_stats, but if it’s slow (even for log files), VLFs aren’t the first place I look. I usually check for things like 4k NTFS allocation units, RAID 5, writing too much to storage, etc.
Hello Brent, I am having trouble reading the results from Crystal Disk Mark. I am using a NetApp for the sql server data files and a raid 10 for the OS. I am running SQL Server 2008 R2 Enterprise x64 on Server 2008 R2 Enterprise (this is a cluster). I went through the bandwidth reference poster and I still dont understand the results.
Below are my Crystal Disk Mark results, are these good or bad?
How do I compare the results with the bandwidth reference poster?
———————————————————————–
CrystalDiskMark 3.0.2 (C) 2007-2013 hiyohiyo
Crystal Dew World : http://crystalmark.info/
———————————————————————–
* MB/s = 1,000,000 byte/s [SATA/300 = 300,000,000 byte/s]
Sequential Read : 112.708 MB/s
Sequential Write : 87.305 MB/s
Random Read 512KB : 41.564 MB/s
Random Write 512KB : 81.893 MB/s
Random Read 4KB (QD=1) : 0.857 MB/s [ 209.2 IOPS]
Random Write 4KB (QD=1) : 10.148 MB/s [ 2477.5 IOPS]
Random Read 4KB (QD=32) : 27.839 MB/s [ 6796.7 IOPS]
Random Write 4KB (QD=32) : 118.059 MB/s [ 28823.1 IOPS]
Test : 4000 MB [I: 28.9% (578.4/2000.1 GB)] (x5)
Date : 2013/05/10 7:52:15
OS : Windows Server 2008 R2 Enterprise Edition (Full installation) SP1 [6.1 Build 7601] (x64)
Rick – howdy sir! The MB/s numbers are megabytes per second, and that compares to the megabytes per second number on the poster. When you compare those, what’s the fastest number that you’re getting in CrystalDiskMark, and does that correspond to a cable type that Kendra shows on the poster? Does that happen to match up to the cable type that you’re using?
Hello Brent, thank you for responding so quickly! The fastest number I see in CrystalDiskMark is 4K QD32 – 118.1 Write MB/s. That number does not correspond to the cable we are using, we use 8 Gb Fiber Channel cable.
Yep, that would be a sign that you’re probably not getting the performance you really want.
Is the perfmon counter “Disk Read Bytes/sec” and “Disk Write Bytes/sec” the same? Because I see the maximum number as 750 MB in the perfmon counter.
Rick – no, those can be different.
Hello Brent, I updated the HBA drivers and firmware and now I see sequential reads at 205 MB/s. That is a huge difference, here is my question.
Is 205 MB/s a good number if we are using a NetApp?
Rick – well, here’s probably the order I’d check:
First, ask the NetApp sales staff (including their presales engineering) to see if that matches up with the model that they sold you along with the number of drives.
Next, run the same tests against other drives – like the C drive on the server, and the C drive on your own laptop. Use those numbers for comparison.
Finally, compare it to common desktop hard drives using Tom’s Hardware charts: http://www.tomshardware.com/charts/hard-drives-and-ssds,3.html
That’ll give you a good idea of where you’re at relative to a single SATA drive.
Hi, I was wondering in what way the Perfmon counters are different than the CrystalDiskMark figures, as Rick was asking, because I was noticing the same thing here, but I can’t explain it. Is there any correlation between them? Thanks for any insights!
Bert – unfortunately, this isn’t something that I can answer. You may consider posting questions in a place like http://ServerFault.com or http://DBA.StackExchange.com. Thanks!
Quick question, my new server (software raid) shows 284 mb/S and my old server shows 3000 mb/S
(Hardware raid controller). Does the hardware controller really boost the performance that much?
Steve
Steve – unfortunately, I really can’t do performance diagnostics via blog comments. The differences could be anywhere in the stack.
Hi Brent
Couldn’t help noticing that you did a CrystalDiskMark test on the Samsung 840 Pro (512GB) testing various RAID config some time ago.
We are getting a paltry 87MB/s for seq writes for the same Samsung disk in a RAID1 config vs 377MB/s without RAID.
Would this be normal or have your alarm bells going off?!
Andrew – that would have my alarm bells going off.
The verson linked above currently installs OpenCandy adware as described in the EULA.
A portable version without this can be found here:
http://sourceforge.jp/projects/crystaldiskmark/downloads/46482/CrystalDiskMark3_0_3b.zip
The link to CrystalDiskMark doesn’t seem to have a valid program. Do you have another link location for this software?
Jeff – it’s the “Download” link on that page. (I just checked.)
Hello…can u please take a look at my results
Seq –> Read :162.2 Mb/s Write :153.3 Mb/s
512K –> Read :43.01 Mb/s Write :117 Mb/s
4K –> Read :0.718 Mb/s Write :4.458 Mb/s
4K QD32 –> Read : 13.42 Write :16.58
Seq –> Read :162.2 Mb/s Write :153.3 Mb/s
These are on a brand new EQ 4100x…2 x1 Gb iSCSI…nothing is connected except the testing volumes
Dell told me that the SAN is running just fine but i just admit that this is the best 22 HDDs -RAID 50 can deliver…
I tried to point them to these poor results from CD or Hdtune but i hit a brick wall that they are not validated and only IOmeter is good…
Take a note that when Iometer runs on 64 threads i saturated the network bandwidth but when i reduced the threads to 1 i get around 30 Mb/s….to me it seems bizarre
John T – yeah, that’s fairly typical of what I see with that type of storage gear.
So we spend a load of money to get 0.7 Mb/s….:(
Ok dumb question just saw your video, you referenced downloading the portable version. Copied to my SAN on my sql server (I was RDP’d to it) And it shows not disk drive
Tim – I’m not quite sure what you’re asking – can you rephrase it?
I googled the error it looks like this is common that the program does not work with certain storage devices
In case anyones interested.
Dell Compellent Sc4020 with 24 * 15K 300Gb, 24 * 1TB 7200, 8 * 8Gb FC backend (2 * 8Gb FC to each Server), Auto Storage Tiering, Dell Fast Track.
9 Runs of 4Gb in Crystal Mark, each San Controller has 16Gb cache so that may be affecting results.
The Test Server is HyperV 2012R2 (running on a 3 Node HyperV 2012 R2 cluster). The test drive is a Dynamic .vhdx of 100Gb dedicated for the test. No other SAN activity is occuring at the time of these tests as it is PreProd.
Also, CSV cache has been increased from 0Gb (default) to 16 Gb.
———————————————————————–
CrystalDiskMark 3.0.3 x64 (C) 2007-2013 hiyohiyo
Crystal Dew World : http://crystalmark.info/
———————————————————————–
* MB/s = 1,000,000 byte/s [SATA/300 = 300,000,000 byte/s]
Sequential Read : 1979.379 MB/s
Sequential Write : 238.530 MB/s
Random Read 512KB : 1878.255 MB/s
Random Write 512KB : 182.255 MB/s
Random Read 4KB (QD=1) : 71.724 MB/s [ 17510.8 IOPS]
Random Write 4KB (QD=1) : 6.002 MB/s [ 1465.4 IOPS]
Random Read 4KB (QD=32) : 385.019 MB/s [ 93998.8 IOPS]
Random Write 4KB (QD=32) : 29.038 MB/s [ 7089.5 IOPS]
Test : 4000 MB [X: 0.1% (0.1/99.9 GB)] (x9)
Date : 2014/11/02 16:39:33
OS : Windows Server 2012 R2 Server Standard (full installation) [6.3 Build 9600] (x64)
Mike – that’s interesting, but I think the number of variables (VM, CSV cache, tiering) makes things a little unpredictable. I’m also rather disturbed by how low those random writes are – there’s something wrong there. I’ve seen much higher with Compellent gear, so I’d say it’s probably time to start troubleshooting. Thanks though!
So I did a few runs of SQLIO just to compare.
Hard to compare exactly but these are much better results.
sqlio v1.5.SG
using system counter for latency timings, 2539059 counts per second
parameter file used: param.txt
file C:\ClusterStorage\Volume2\Test\testfile.dat with 2 threads (0-1) using mask 0x0 (0)
2 threads writing for 120 secs to file C:\ClusterStorage\Volume2\Test\testfile.dat
using 4KB random IOs
enabling multiple I/Os per thread with 32 outstanding
buffering set to not use file nor disk caches (as is SQL Server)
using specified size: 50000 MB for file: C:\ClusterStorage\Volume2\Test\testfile.dat
initialization done
CUMULATIVE DATA:
throughput metrics:
IOs/sec: 36100.69
MBs/sec: 141.01
latency metrics:
Min_Latency(ms): 0
Avg_Latency(ms): 1
Max_Latency(ms): 50
histogram:
ms: 0 1 2 3 4 5 6 7 8 9 10 11 12 13 14 15 16 17 18 19 20 21 22 23 24+
%: 3 73 23 1 0 0 0 0 0 0 0 0 0 0 0 0 0 0 0 0 0 0 0 0 0
quick note: diskmark doesn’t work with mount points
quick note2: a workaround for the mount point issue is using SUBST on the command line
So cool, thanks for the trick!
glad to read someone else is using mount points 🙂
Sadly, CrystalDiskMark installs sh*tware.
Be careful.
Joe – yep, that’s why I said the portable edition. Thanks!
got a new EMC SAN moved all database storage to it last month Seeing some disk queue backups on our OLTP server which is a 2008 Act/passive cluster. I compared it’s speed to our data warehouse server which is attached to the same SAN. i was a little concerned by some numbers. Based upon your article I focused on the 4K QD32 and 4k results. On 2 of the main drives on the OLTP Cluster I got
4k 17.42 6.21
4kQD32 66.61 40.33
4k 13.41 6,25
4kQD32 168.81 109.8
on my DWH server I got on the 2 largest drives
4k 33.8 13.83
4KQD32 274.4 136.8
4k 29.9 9.93
4KQD32 265.1 136.81
It seems to the naked eye I have an issue
Tim – if you’re doing load testing, you can ignore the 4k results because as the article states, “This is somewhat akin to a lightly loaded OLTP server.” If you’re under light loads, storage isn’t really a bottleneck.
I’d also check out my Building the Fastest SQL Servers video from TechEd. If your OLTP server hits disk for queries, it’s never going to be fast enough: https://channel9.msdn.com/Events/TechEd/NorthAmerica/2012/DBI328
Hi guys,
I’m helping a customer trouble shoot a SQL Server install based on Vmware and connected to a Fujitsu DX60 SAN via 1Gbs iSCSI ethernet. Looking at some of the numbers above, I believe the root of our problem lies in the I/O contention on the SAN – here’s the best numbers I got testing 4000mb files / 5 times as recommended above;
SEQ – 107.0 MB/s Read 59.33 MB/s Write
512K – 31.01 Read 55.51 Write
4k – 0.817 Read 4.520 Write
4K – 8.562 4.735 Write
QD32
The LUN’s are shared between Exchange / SQL / F&P and Term Services so I’m thinking that the SAN gets saturated from time to time so we are seeing really IO in SQL server – like 25-35ms and this is causing lots of cxpacket waits and lock / latch errors – am I on the right track to we think?
Whats the best path forward – moving to SSD shelf? Vendor is talking about installing 15k drives but I don’t think that will help so much – I think its fabric related more than anything?
Your thoughts would be appreciated.
Cheers
Darren
Darren – yep, sounds like you’ve got some bad throughput there. Unfortunately, personalized diagnostics of a SAN is kinda beyond the scope of something we can do in a blog comment. That’s what we do for consulting, actually. If you’re interested in that, hit the Contact link at the top of the page and we can tell you about our 4-day SQL Critical Care® process.
We had a client who had the same setup, I would be worried if there is any sharing of the SAN with Exchange. We finally convinced them to separate them and wow all is good. Too many background functions in Exchange that happen that killed the server.
great
Hello team Ozar,
I’m testing my new server’s throughput and am looking at a version 4.0 of CrystalDiskMark. Can you provide some guidelines on testing with the new version in terms of the Queues and threads setting? Also, how should I interpret the results for Seq Q32T1 (the default test with 32 queues and 1 thread) vs the results for SEQ? Does the recommended throughput suggested in the SQL Server Checklist.pdf still apply to SEQ in version 4.0?
Ron – unfortunately we haven’t used v4 yet.
Thanks for the quick response. I will use version 3.
Nimble Storage CS300
Seq Q32T1 – 247.3 – 246,5
4K Q32T1 – 182.0 – 172.5
Seq – 107.0 – 106.1
4K 5.871 – 5.765
Brent is SQLIO even a valid test anymore since it writes/reads only Zero’s? As know some of the newer SAN’s detect zero’s and don’t even get to the disk/ssd, at this point we are pretty much testing Controllers.
Thanks for the article
Firasath – exactly what I was wondering. I was seeing preposterously high results in a VMWare Player virtualized environment with SQLIO, presumably because of the data file being all zeroes. I worked around that, though. You can make a small 1k file of random data using PowerShell like so:
[Byte[]]$out=@(); 0..2047 | %{$out += Get-Random -Minimum 0 -Maximum 255}; [System.IO.File]::WriteAllBytes(“1k.dat”,$out)
You can double the file to 2k with a command line like…
copy /b 1k.dat + /b 1k.dat 2k.dat
…and keep doing that kind of logic to double the file to the size you want. Then specify that file in your SQLIO read test to get a more accurate result. (Of course a write test that writes all zeroes again into the file will undo the randomization of data content and probably revert to unrealistically good results.)
Using the random data file told me my disk performance under virtualization was 19.8 megabytes per second, not the all-zeroes mismeasurement of 248.8, when running from a PNY 32GB SD RAM card.
and what if you used “fsutil file createnew” along with “fsutil file setvaliddata”? If I’m not mistaken you also get a non-zeroed data file
I have stopped using SQLIO, diskspd has better knobs and does write random data to the files. Another thing i have learned in process of testing many different SAN’s is when you create your sample file make sure it is more than the size of SAN cache, you really want to blow away the cache and have data written to the underlying disks.
Hi guys, I am a rather novice in SQL matters but have been Reading quite a lot of your articles and find it very interesting and helpful. We have a customer where we have installed an application using SQL as DB Engine, and since the customer moved the entire installation to a Blade server with storage on a SAN we have experienced problems with slowness in our application (which is constantly using SQL). Customer has all SQL databases and Log file placed on the E: drive, which is the same logical drive as C (which i suspect is on SAN storage, and most likely shared with numeruous other applications. I Was running CrystalDiskMark on the E: drive (and got this result:
———————————————————————–
CrystalDiskMark 5.1.2 x64 (C) 2007-2016 hiyohiyo
Crystal Dew World : http://crystalmark.info/
———————————————————————–
* MB/s = 1,000,000 bytes/s [SATA/600 = 600,000,000 bytes/s]
* KB = 1000 bytes, KiB = 1024 bytes
Sequential Read (Q= 32,T= 1) : 162.085 MB/s
Sequential Write (Q= 32,T= 1) : 99.615 MB/s
Random Read 4KiB (Q= 32,T= 1) : 3.182 MB/s [ 776.9 IOPS]
Random Write 4KiB (Q= 32,T= 1) : 1.334 MB/s [ 325.7 IOPS]
Sequential Read (T= 1) : 43.417 MB/s
Sequential Write (T= 1) : 44.458 MB/s
Random Read 4KiB (Q= 1,T= 1) : 0.479 MB/s [ 116.9 IOPS]
Random Write 4KiB (Q= 1,T= 1) : 0.319 MB/s [ 77.9 IOPS]
Test : 1024 MiB [E: 70.1% (161.0/229.6 GiB)] (x5) [Interval=5 sec]
Date : 2016/02/16 11:48:58
OS : Windows Server 2008 R2 Server Standard (full installation) SP1 [6.1 Build 7601] (x64)
Comparing it to testing on the G: drive which most likely is local attached storage:
———————————————————————–
CrystalDiskMark 5.1.2 x64 (C) 2007-2016 hiyohiyo
Crystal Dew World : http://crystalmark.info/
———————————————————————–
* MB/s = 1,000,000 bytes/s [SATA/600 = 600,000,000 bytes/s]
* KB = 1000 bytes, KiB = 1024 bytes
Sequential Read (Q= 32,T= 1) : 760.456 MB/s
Sequential Write (Q= 32,T= 1) : 796.739 MB/s
Random Read 4KiB (Q= 32,T= 1) : 135.912 MB/s [ 33181.6 IOPS]
Random Write 4KiB (Q= 32,T= 1) : 154.893 MB/s [ 37815.7 IOPS]
Sequential Read (T= 1) : 563.322 MB/s
Sequential Write (T= 1) : 336.619 MB/s
Random Read 4KiB (Q= 1,T= 1) : 8.100 MB/s [ 1977.5 IOPS]
Random Write 4KiB (Q= 1,T= 1) : 13.505 MB/s [ 3297.1 IOPS]
Test : 4096 MiB [G: 14.9% (44.8/299.9 GiB)] (x5) [Interval=5 sec]
Date : 2016/02/16 12:03:23
OS : Windows Server 2008 R2 Server Standard (full installation) SP1 [6.1 Build 7601] (x64)
You Think it would be wise to move all SQL files to the G: drive instead (the easy solution) to get better performance from SQL Server?
Cheers and thanks in advance,
Rolf – personalized architecture advice is a little beyond what we can do in a blog post comment. For example, I’d want to check wait stats to see if storage is actually the SQL Server’s primary bottleneck. If you’re interested in working with us on a consulting engagement, click Contact at the top of the screen, and you can set up a free 30-minute sales call with Jessica, our sales pro.
As Brent said it is hard to pin point without having more details.
Crystaldiskmark is good but diskspd is much better. There are many SAN’s out there for whatever reason they have max cap on IO’s on each LUN, in your case it might help to have data and log files put on separate drives. Without seeing more details it is hard to say. If you can execute diskspd and send me the result, my buddy has awesome excel sheet which takes diskspd outfile file and puts in nice graphs.
Brent,
Is there plans to update this article now that CrystalDiskMark has changed quite a bit since the time of writing?
Bryan – sure, what do you think needs to be changed?
I’m not super familiar with the Crystal Mark tool. I couldn’t really find must documentation on it, (perhaps i just didn’t look at the right spot…) In the info above, it says 4K QD32 is like an Active OLTP. Is 4K Q32T1 the same as 4K QD32? I can’t seem to find what the D was for in version 3. Also, it now hows SEQ and SEQ Q32T1. Which one would be similar to the Data Warehouse, still the SEQ? Also, i was watching your TechED talk on this and you mentioned you’d prefer a size of 8GB for testing, but it didn’t exist at the time. Now it has all the way up to 32 GB. The screen cap above shows 4GB but the text says use 32GB. Do you have a size you prefer or just as long as it’s larger than the cache it’s ok?
Thanks for the help!
Yep, make sure to read the post carefully – the post is up to date, while the screenshots may be from older versions. Thanks!
Brent,
If i run crystal diskmark on production server? Will it impact my server?
James – yes.
Is it normal to have a drop in throughput when striping? I would have assumed it’d be always growing:
http://pasteall.org/pic/show.php?id=118645
— massive drop in Seq 32T1 when testing 2 SSDs instead of 1~ I’ve tried with 5 runs (rather than the 2 in screenshot) but still bad results & I’ve tried the each disk separately & they both do about 430mb/s when not striped
Mike – for Q&A, head on over to https://dba.stackexchange.com.
Will just mark it down as a Crystal bug~ problem goes away with 3/4 drives & DiskSpd continuously grows
mmm…I have unzipped the CrystalMark app on my Dev server and when I launch it a “Disk Not Found” message appears and I cannot run the test. I wonder what is going wrong.
Nevermind; bad downloaded file.
If it runs 5 loops for test, the test result will demonstrate the best score or average of 5 loops?
Thanks.
For support questions about CrystalDiskMark, your best bet is to contact the authors.
[…] tests are incredibly low, but that’s likely due to the fact that they’re attempting to read and write tiny 4KB files all around the drive—a technique that mechanical hard drives don’t do very well with, […]
I do not like much this test tool CrystalDiskMark 6.0.2 x64 because it is next to impossible to analyze the results logically, systematically!
There should be for each row of the results screen output, for each particular device tested (SSD, HD, etc.), a bracket of acceptable values. Outside this bracket of acceptable values, you would have values that indicate problems with your hardware device. Nothing of the sort exist.
Sounds like something you’d want to start building, then. That’s exactly how open source projects get started – when someone needs something that doesn’t exist. Roll up your sleeves and get started! It might catch on.
Any idea why my C drive would have this result..
———————————————————————–
CrystalDiskMark 6.0.2 (C) 2007-2018 hiyohiyo
———————————————————————–
Sequential Read (Q= 32,T= 1) : 190.420 MB/s
Sequential Write (Q= 32,T= 1) : 31.929 MB/s
Random Read 4KiB (Q= 8,T= 8) : 2.698 MB/s [ 658.7 IOPS]
Random Write 4KiB (Q= 8,T= 8) : 0.583 MB/s [ 142.3 IOPS]
Random Read 4KiB (Q= 32,T= 1) : 2.869 MB/s [ 700.4 IOPS]
Random Write 4KiB (Q= 32,T= 1) : 0.425 MB/s [ 103.8 IOPS]
Random Read 4KiB (Q= 1,T= 1) : 0.200 MB/s [ 48.8 IOPS]
Random Write 4KiB (Q= 1,T= 1) : 0.149 MB/s [ 36.4 IOPS]
Test : 1024 MiB [C: 30.1% (18.0/60.0 GiB)] (x5) [Interval=5 sec]
Date : 2019/06/11 22:38:04
OS : Windows Server 2003 SP2 [5.2 Build 3790] (x86)
And my D drive would have this result???
———————————————————————–
CrystalDiskMark 6.0.2 (C) 2007-2018 hiyohiyo
———————————————————————–
Sequential Read (Q= 32,T= 1) : 21.837 MB/s
Sequential Write (Q= 32,T= 1) : 4.168 MB/s
Random Read 4KiB (Q= 8,T= 8) : 2.279 MB/s [ 556.4 IOPS]
Random Write 4KiB (Q= 8,T= 8) : 0.434 MB/s [ 106.0 IOPS]
Random Read 4KiB (Q= 32,T= 1) : 1.922 MB/s [ 469.2 IOPS]
Random Write 4KiB (Q= 32,T= 1) : 0.449 MB/s [ 109.6 IOPS]
Random Read 4KiB (Q= 1,T= 1) : 0.180 MB/s [ 43.9 IOPS]
Random Write 4KiB (Q= 1,T= 1) : 0.128 MB/s [ 31.3 IOPS]
Test : 1024 MiB [D: 58.7% (317.0/540.0 GiB)] (x5) [Interval=5 sec]
Date : 2019/06/11 22:38:34
OS : Windows Server 2003 SP2 [5.2 Build 3790] (x86)
Both drives are in one RAID-5 array on a XenServer. Trying to find out why this server is performing so poorly. I have other Xen servers that are comparable and have these results…
———————————————————————–
CrystalDiskMark 6.0.2 (C) 2007-2018 hiyohiyo
———————————————————————–
Sequential Read (Q= 32,T= 1) : 532.111 MB/s
Sequential Write (Q= 32,T= 1) : 30.357 MB/s
Random Read 4KiB (Q= 8,T= 8) : 11.131 MB/s [ 2717.5 IOPS]
Random Write 4KiB (Q= 8,T= 8) : 2.651 MB/s [ 647.2 IOPS]
Random Read 4KiB (Q= 32,T= 1) : 11.249 MB/s [ 2746.3 IOPS]
Random Write 4KiB (Q= 32,T= 1) : 2.596 MB/s [ 633.8 IOPS]
Random Read 4KiB (Q= 1,T= 1) : 1.816 MB/s [ 443.4 IOPS]
Random Write 4KiB (Q= 1,T= 1) : 0.566 MB/s [ 138.2 IOPS]
Test : 1024 MiB [D: 27.8% (19.4/70.0 GiB)] (x5) [Interval=5 sec]
Date : 2019/06/11 22:41:45
OS : Windows Server 2003 R2 Enterprise Edition SP2 [5.2 Build 3790] (x86)
———————————————————————–
CrystalDiskMark 6.0.2 (C) 2007-2018 hiyohiyo
———————————————————————–
Sequential Read (Q= 32,T= 1) : 316.975 MB/s
Sequential Write (Q= 32,T= 1) : 26.218 MB/s
Random Read 4KiB (Q= 8,T= 8) : 10.244 MB/s [ 2501.0 IOPS]
Random Write 4KiB (Q= 8,T= 8) : 1.919 MB/s [ 468.5 IOPS]
Random Read 4KiB (Q= 32,T= 1) : 5.007 MB/s [ 1222.4 IOPS]
Random Write 4KiB (Q= 32,T= 1) : 1.335 MB/s [ 325.9 IOPS]
Random Read 4KiB (Q= 1,T= 1) : 1.155 MB/s [ 282.0 IOPS]
Random Write 4KiB (Q= 1,T= 1) : 0.383 MB/s [ 93.5 IOPS]
Test : 1024 MiB [D: 27.8% (19.4/70.0 GiB)] (x5) [Interval=5 sec]
Date : 2019/06/11 22:51:11
OS : Windows Server 2003 R2 Enterprise Edition SP2 [5.2 Build 3790] (x86)
Sorry, I can’t do free personal consulting in comments.
[…] low, however that’s probably as a consequence of the truth that they’re making an attempt to learn and write tiny 4KB information throughout the drive—a method that mechanical exhausting drives don’t do very effectively with, […]
Hi Brent, we are planning to move our SQL server (VM) from our current vendor to Azure VM. When I restore DB on our current production, it takes around 2 minutes, but on Azure VM, it takes around 15 minutes. So, I wanted to check storage speed on both sides. When I run CrystalDiskMark on our current production SQL server (Yes, I did it in production, but I couldn’t resist :)), I get significantly higher read/write numbers than Azure VM.
Production Seq read 2150 MB/s
Production Seq write 502 MB/s
Azure Seq read 67 MB/s
Azure Seq write 67 MB/s
On Azure VM, we have Premium SSDs. Is it normally the case with Azure Premium SSDs? Is there a good benchmark that we can use to make sure our drives are at that benchmark or higher? I couldn’t find storage bandwidth reference poster someone mentioned in the comments.
As always, thanks for your help!!!
Raj – unfortunately, I can’t do free personal consulting in the comments. We no longer offer the bandwidth reference poster.
[…] How Fast is Your Storage? – I show you how to use the free CrystalDiskMark tool to do a fast load test on solid state drives and SANs. […]
[…] you want to check your storage speed before downloading the Stack database, run a test with CrystalDiskMark. You want at least 1,000 MB/sec for sequential reads and writes. As an example, my laptop’s SSD […]
Sequential 1MiB (Q= 8, T= 1): 119.963 MB/s [ 114.4 IOPS]
Sequential 1MiB (Q= 1, T= 1): 94.364 MB/s [ 90.0 IOPS]
Random 4KiB (Q= 32, T=16): 0.941 MB/s [ 229.7 IOPS]
Random 4KiB (Q= 1, T= 1): 0.334 MB/s [ 81.5 IOPS]
[Write]
Sequential 1MiB (Q= 8, T= 1): 115.567 MB/s [ 110.2 IOPS]
Sequential 1MiB (Q= 1, T= 1): 106.744 MB/s [ 101.8 IOPS]
Random 4KiB (Q= 32, T=16): 1.207 MB/s [ 294.7 IOPS]
Random 4KiB (Q= 1, T= 1): 0.922 MB/s [ 225.1 IOPS]
Profile: Default
Test: 1 GiB (x5) [Interval: 5 sec]
Date: 2020/12/18 10:23:10
OS: Windows 10 Professional [10.0 Build 18363] (x64)
Can some let me know if this is bad or ok. Not a tech head so need help
Captain – for personal consulting help, click Consulting at the top of the site. Thanks!
How does CrystalDiskMark eliminate the interference of other processes which are using the disk at the same time? Perhaps I am missing something: I presume CDM can only write a block of sequential data and measure how long that takes. Perhaps there is a smarter way–I know nothing here.
It doesn’t. That’s one of the reasons you don’t install other apps on a SQL Server, and you don’t share your car with other people.
For those working in a DOE shop, there is something called WLS from the Kansas City Plant you may be obliged to run for security purposes. WLS does interfere with the CrystalDiskMark benchmark by keeping a handle open on the temp file that CrystalDiskMark creates. For larger files this causes CrystalDiskMark to report zero (0) MB/s Write speeds.
Crucial P5 Plus 1TB
https://i.imgur.com/dp5L3X0.png
This tool is Useless I cannot get any speed check on one of my perfectely functioning HDD, I get an error message. And no body knows what it means. This is not an acceptable answer for this company software.
error: Disc Capacity is Insufficient
Hello there I recently purchased a new Sandisk SDCZ74-512G-G46 – Unidad Flash USB 3.1 (512 GB) in Amazon but tested on CrystalDisk to find a RND4K of 0.01 should I be worried and return this “defective” usb?
Unfortunately I don’t really do customer support for Sandisk or Amazon. Hope that’s fair.